
Supporting decision-making in Trafford by creating visualisations that reveal patterns in data. Part of @TraffordCouncil #opendata #opensource
Trafford, Greater Manchester
Joined August 2011
- Tweets2.8K
- Following270
- Followers1.9K
- Likes478


Pinned Tweet
Our #COVID19 monitor app has been overhauled to include the latest 7-day case counts for all MSOAs in England | trafforddatalab.shinyapps.io… | #rstats
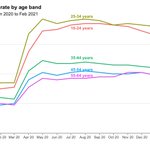
High levels of claimant rate for young adults in Trafford | trafforddatalab.io/charticle… | #charticle

Our #COVID19 apps are highlighted in a new @CDEIUK report into the use of #AI and #datadriventechnology in the UK’s #COVID19 response: gov.uk/government/publicatio… #localgov #opendata #rstats

Stark differences in life expectancy across Trafford | trafforddatalab.io/charticle… | #charticle

Want to learn more about dot plots, Marimekko charts and isotypes? Check out the "One Chart at a Time" video series by @jschwabish | youtube.com/playlist?list=PL… #dataviz

Explore police recorded crime retrieved from data.police.uk in your local authority, ward or LSOA with our Crime Scanner app | trafforddatalab.io/crime_sca…


A North-South divide in Internet engagement in Trafford? New #charticle using 2018 Internet User Classification data from the @CDRC_UK: trafforddatalab.io/charticle…

Minor update to our reachability plugin based on the fantastic API by @ors_news: v2.0.1 has updated attribution for OpenRouteService and OpenStreetMap. Please use the latest version! @MappingGM | github.com/traffordDataLab/l…

This graphic by @jburnmurdoch is very powerful and rightly credits the recent work of @carlbaker at the @commonslibrary and @VictimOfMaths. The underlying data is available too. Great stuff!


Animating weekly #COVID19 case rates in Greater Manchester | </> gist.github.com/rcatlord/a07… | #ggplot2 #sf #gganimate #rstats #30DayMapChallenge
The presentations given at this year's @NHSrCommunity Conference are up: youtube.com/playlist?list=PL… Well worth a watch! #NHSRconf2020 #rstats

Trafford Data Lab retweeted

Check out these great re-creations of @ftdata's helpful Visual Vocabulary in R, Vega, Vega-Lite, Excel, PowerBI, and Tableau. 1/7

We've got a bunch of reproducible #opendata visualisations in our expanding library of #charticles | trafforddatalab.io/charticle… | #charticles #rstats #ggplot2
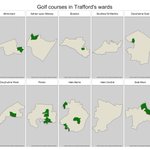
Almost 16% of Sale Moor is a golf course | trafforddatalab.io/charticle… | @undertheraedar

Explore the latest available Department for Education information about schools in Trafford interactively | trafforddatalab.io/schools

Almost one in four of Old Trafford households have no access to a private or shared garden | trafforddatalab.io/charticle…

Redwings, Black-headed Gulls, Whooper Swans and other birds of conservation concern spotted recently on Carrington Moss | trafforddatalab.io/charticle… | @FriendsMoss @Team_eBird @BBCSpringwatch #BoCC4

We are one of many case studies included in the @greatermcr Local Data Review which aims to identify and address the barriers to publishing local public sector data. There is much to learn from the results of this review | greatermanchester-ca.gov.uk/… | @TraffordCouncil @PaulJames55

Visits to restaurants and supermarkets in Trafford are plateauing. New #charticle using Google #COVID19 community mobility data | trafforddatalab.io/charticle…

Child poverty levels in Trafford remain static | trafforddatalab.io/charticle… | @EndChildPoverty #GreaterManchester
