
words 🤝 numbers 🤝 pictures | writer @datawrapper
Joined June 2021
- Tweets54
- Following98
- Followers682
- Likes216






Rose Mintzer-Sweeney retweeted

There's been a crazy deal on offer: Drive your car into Manhattan, whenever you want, for free. Is free the right price? And why has it been so hard to change? 🚇
A Weekly Chart from our writer @rosemintzers:
blog.datawrapper.de/new-york…

Rose Mintzer-Sweeney retweeted
🧰 It's a new Fix My Chart! What makes a well-written color key? Should that subtitle be a footnote? In this edition, our writer @rosemintzers has advice on where to place text in data vis:
blog.datawrapper.de/fix-my-c…
Rose Mintzer-Sweeney retweeted
Are you tired of waiting for big files to upload? Why not consider a pigeon?
Inspired by @janicekchen's visualizations, our writer @rosemintzers ran the numbers on European internet speeds — and where a carrier pigeon might get the job done faster 🪶
blog.datawrapper.de/pigeon-i…
Rose Mintzer-Sweeney retweeted
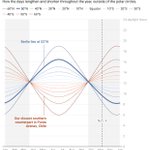
New Weekly Chart! Our writer @rosemintzers is on the blog this week with the changing seasons, a massive crowdsourced citizen-science project, and tricks for incorporating images into your Datawrapper maps 🍁🐦⬛🗺️
blog.datawrapper.de/birdwatc…
Rose Mintzer-Sweeney retweeted
This week marks the THREE HUNDREDTH installment of the Weekly Chart series! Our writer @rosemintzers looks back at the past five-plus years in charts.
More analysis, memories, and Weekly Chart "playlists" on our blog 🎧
👉 blog.datawrapper.de/300th-we…


Rose Mintzer-Sweeney retweeted

🎉🍾🎇 100!!
For over two years we've been compiling a collection of the best #dataviz out there. Most of these Dispatches were created by my colleague @rosemintzers - thanks for all that excellent work, Rose!

It's the 100th Data Vis Dispatch! We're celebrating just the way we like to — with lots of great charts and maps on everything from gender equality to hot dogs to the Loch Ness Monster 🥂
The party continues on our blog:
🎉 blog.datawrapper.de/data-vis…


Rose Mintzer-Sweeney retweeted
New Weekly Chart! Our writer @rosemintzers maps out the results of the Central Park Squirrel Census 🌰
blog.datawrapper.de/central-…

Rose Mintzer-Sweeney retweeted
New Weekly Chart! In a democracy, does one voter ever have the final word? It may not be common — but it is possible. Our writer @rosemintzers ran the numbers to see where America's kingmaker is most likely to be found.
blog.datawrapper.de/one-vote…

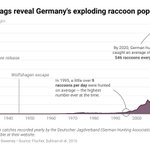
A hundred years ago, no raccoon had ever lived wild in Germany — today, one is probably rummaging through your trash right now. If you live in Kassel, that is.
My latest Weekly Chart on the 20th century's great raccoon escapes:
🦝 blog.datawrapper.de/raccoons…

ALT A line chart showing Germany's estimated raccoon population growing exponentially from 1930-2020

ALT A choropleth map showing the estimated raccoon population density in each district of Germany. The raccoon "hotspots" are in Hesse and Brandenburg; almost no raccoons live in Bavaria or Baden-Württemberg.
Come be my colleague!
We're looking for TWO new faces in communications — a second data vis writer to join me on the blog as well as an evangelist for workshop and video formats.
Feel free to get in touch with any questions about what it's like to work at Datawrapper 🌟

If you're excited about #dataviz, this might be your dream job: We're hiring two new team members who will work closely with the great @rosemintzers and me in the future. Let me tell you more 🧵.
Most Americans are women. But that's not true in every town. And it wasn't true in every era.
A look at the geography of gender, and what it says about U.S. history:
blog.datawrapper.de/gender-r…
Rose Mintzer-Sweeney retweeted
🎉🎉🎉 Big news: Datawrapper now supports right-to-left languages in all charts, maps, and tables!
Learn more here:
blog.datawrapper.de/right-to…
How do you prefer to read charts in your right-to-left language? Please weigh in and share!
(Readers of other RTL languages like Urdu, Persian, etc. also very welcome to comment 📉)
A question for all Arabic and Hebrew-speaking people out there: In a #dataviz in your language with a date/time x-axis, would you prefer it to go from right to left, or from left to right? (Polls in the next tweets!)
Examples: datadashboard.health.gov.il/… & inkyfada.com/ar/2021/08/20/%…

ALT Two Hebrew data visualizations with an x-axis that shows the dates going from left to right

ALT Part of a line chart showing the x-axis going from right to left
In case you missed it: this week's Data Vis Dispatch is full of amazing maps, with a huge section on the French presidential election 🇫🇷
blog.datawrapper.de/data-vis…


This Dispatch doesn't cover the work of one week — it's a look back at the entire COVID era in data vis. Which is now entering its... third year.
Data journalists took this lemon of a story and made some delicious visual lemonade. Take a look 🍋
blog.datawrapper.de/data-vis…


In case you missed it: I put my Wordle skills under the information-theory microscope (and recreated the game as a Datawrapper table along the way) ⬜️🟨🟩
blog.datawrapper.de/wordle-s…

If you work in data communications for the public health department of New York City, the past two years have been a wild ride.
Matthew Montesano explains how he and his colleagues rose to the occasion 🌇
blog.datawrapper.de/nyc-heal…

The world is full of truly horrible stuff, but sometimes you get a great popular linguistics article, so... who's to say, really?
blog.datawrapper.de/data-vis…


This week's Data Vis Dispatch has hazardous waste (in the middle of a city), power failures (in the middle of a heat wave), and "work-related" parties (in the middle of a lockdown) 🤐
blog.datawrapper.de/data-vis…


This week's Data Vis Dispatch is out, with work from @SBSDataJ, @HeraldandNews, and @OurWorldInData! (And yes, "the spiral" is there.)🌀
blog.datawrapper.de/data-vis…


