

Enrich your stories with charts, maps, and tables – interactive, responsive, and on brand. Questions? Write us: [email protected]
- Tweets4.7K
- Following615
- Followers27K
- Likes5.9K
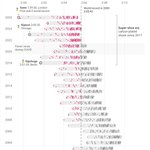






ALT Yearly chart of top-50 men's marathon finishing times (2000–2026) showing many recent performances (pink dots) now faster than the 2000 world record (dashed line at 2:05:42), with clear improvement after the 2017 "super‑shoe" era and fewer races during COVID.

ALT Yearly chart of top-50 women's marathon times (2000–2026) with pink dots marking performances faster than the 2000 world record (2:20:43), highlighting faster results since the 2017 super‑shoe era.

ALT Mini area charts for eight major marathons (Tokyo, Sydney, Chicago, New York, Berlin, Paris, London, Boston) showing a clear spike in finishers in the five minutes before 4:00 hours versus after.

ALT Ridgeline chart showing per-minute share of Boston Marathon finishers by year (2000–2026), with the peak finishing distribution shifting left and median times falling over time to 3:28 in 2026, indicating runners overall have gotten faster.

ALT An infographic illustrating the growth of Thailand's Girls' Love industry. In 2022, GAP The Series was the first Girls' Love series to air on Thai free-to-air television. It reached millions of viewers and attracted international audiences across Asia and Latin America. By 2026, the genre had grown, with 33 Girls' Love series having aired or being set to air, bringing the total number of airings on free television since 2022 to 52. Published by Kontinentalist.

ALT A Sankey diagram showcasing China’s current green energy generation and the excess resulting in significant amounts of unused energy. In the first half of 2026 alone, approximately 9% of China's wind and solar energy was left unused. Published by Bloomberg.

ALT A population pyramid showing Brazil’s age distribution from 1950 to a projected 2100. While the population was 53.4 million in 1950, it is projected to reach 163 million by 2100. Published by Karim Douïeb.

ALT A visualization showcasing the lives of Nobel laureates from their birth year to the year they won their prize in physics, chemistry, or medicine. The youngest winner was Lawrence Bragg, who won the Physics Prize at the age of 25, while the oldest was John B. Goodenough, who won the Chemistry Prize at the age of 97. Published by Elia Kabanov.

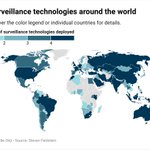
ALT World map titled "AI surveillance technologies around the world" using a color scale from light to dark to indicate increasing numbers of deployed AI surveillance technologies, with darkest countries showing the highest deployment.

ALT Bar chart comparing share of countries by regime using AI surveillance tech with highest use of smart policing and facial recognition in liberal democracies, safe city systems in electoral autocracies, and social media surveillance most common in closed autocracies.

ALT Scatterplot mapping countries by democracy score vs digital repression, with points colored by surveillance supplier and sized by number of technologies deployed. North Korea is the most repressive and least democratic country, which doesn't use U.S. or Chinese technology. Germany, on the other hand, is among the most democratic and least repressive, and uses surveillance technology from both China and the U.S.

ALT Hundreds of 3D figures colored by whether they say religion is important in their daily life. A line chart shows that in Western countries, young people are the most likely to believe in an afterlife without being religious, while in non-Western countries it's older people.

ALT A hand-drawn line chart showing the share of correct answers students gave on tests from 2020 to 2025. After ChatGPT became popular, scores on tests taken at their computers kept rising, while scores on proctored tests away from their computers dropped below where they had been before A.I.

ALT An alluvial chart showing how the 120 seats in Israel's parliament were split between parties in every election since 2009, with bands showing how members moved between parties. Likud stays the largest party, while the center parties keep changing names.

ALT A historical map of Washington's streets around the Capitol, colored by how often they were swept, from daily to once every two weeks.

ALT Map showing Christopher Columbus's four transatlantic voyages (1492–1504) from Spain to the Caribbean, South America, and the coast of Central America.


ALT Line chart comparing room and outside temperatures from 6 am Jul 31 to midday Aug 1, highlighting AC switched on around midnight that cooled the room ~6°C, with room temperature later rebounding.

ALT Line chart titled "Heat accumulated over a few days — even with AC on." Room temperature remains consistently higher than outside from Aug 2–6, showing daily peaks around 30–33°C and warm nights; the brown line (room) indicates gradual heat accumulation despite AC while the grey line (outside) swings more sharply.


ALT A chart presenting changes in the voting preferences of the American population from the 2024 presidential election to the 2026 midterm election. Around 76% of Kamala Harris’s voters intend to vote Democrat in the upcoming midterms, compared to 65% of Donald Trump’s supporters who intend to vote Republican. Published by The Economist.

ALT Two bar charts showcasing the reducing water levels for Lake Powell and Lake mead, Colorado River’s largest reservoirs. Lake Powells water levels is now at 3,517 ft, while Lake Mead is at 1,039 ft. Published by FlowingData.

ALT An election chart displaying the number of seats held by the far-right Alternative for Germany (AfD) party in state parliaments. They currently hold 328 out of 1,884 seats across 15 state parliaments, accounting for a 17.4% share. Published by Berliner Morgenpost.

ALT A collection of maps tracking the shape and size of Africa across various projections. Published by EL PAÍS.

