

culture is bad for you | sl @shefmethods | arts, culture and heritage @creativepec | work with @dcms @artsemergency @audienceagents @uk_ie @bfi | he/him
sheffield/york
Joined March 2008
- Tweets15.1K
- Following1.6K
- Followers2.3K
- Likes13.9K






i was wondering whether they’d name Gojira at all. got as far as “that was Gojira”. they’re a huge cultural export!
the social background questions may not be in the census but there’s consensus on how to ask: gov.uk/government/publicatio…

everyone is already dunking on this for the baffling scale (correct), but: why is Crawley (not a city) included and Carlisle (a city, about the same population) not?
unfortunately there’s no alt text so i can’t find out, and as i live in the north i likely don’t have the skills

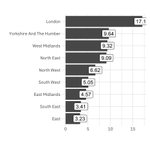
Southern cities are higher skilled than northern ones 🧭
Skills are the driver of economic performance. High-skilled businesses invest where they can recruit the workforce needed to help them grow.
See our 12 charts to inform the election debate 📊👇
loom.ly/5ex4AxI

You might like this dashboard we built; it doesn't give you the numbers of people who can flange a lighting rig for 8k filming at the new framerate, but it does tell you how many people are SOC 3417, which includes that lot app.powerbi.com/view?r=eyJrI…
clueless i'm afraid, but the metadata all looks a bit odd. i've always found UKDS amazingly helpful when i've emailed them so they might be able to solve this mystery

...on further clicking i can see it has been "decatalogued", which should at least reassure you that you're not going mad
yeah, true. (thinking out loud) what about just bar charts in each quadrant? as the LHS of the Sankey is 100% Con
could you do the compass position as the left-hand side of the Sankey (so there's a total of 9 sources)? will have its own problems but i'm curious to see how it looks. (and that high % to Reform in left-authoritarian is v interesting)
