

data + crypto = magic internet money
Joined February 2018
- Tweets172
- Following54
- Followers56
- Likes143





1. OOS regime vs IS regime
2. params: stable plateau on the heatmap or a lone peak?
3. how many variants were tried
4. IC + fwd returns by signal decile
5. any nonlinear transform: economic reason upfront, or fit to the decile chart?
6. results net of costs
Just make sure you clasify "actionable" correctly, because out of 200 at least few can pass the OOS just by chance
It looks much worse on hyperliquid haha. I've recently too had a drawdown on my xs neutral portfolio but not as bad as this one...

Most of you split your data the same way. First two thirds in-sample (IS), last third out-of-sample (OOS).
Then you check the IC, fwd return deciles, the Sharpe...
If the OOS numbers hold up, the strategy is "validated."
Here's how that goes wrong.
Hardly anyone checks what the market was actually doing in each part.
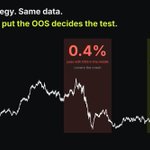
Say the first two thirds holds the crash, the chop and the slow bleed. The last third is one clean bull run.
You optimize on the hard part. Every parameter tweak that dodges a bad stretch pushes the IS Sharpe up. By the end, the model is great at surviving that one crash and that one chop.
Then it reaches the OOS. A bull run, where almost anything that's long makes money. It passes.
But the test never asked the real question: does this work in a hard market it wasn't tuned on? Every hard market went into the tuning. Only the easy one was left for the grade.
Before you look at a single metric, look at the chart:
- What regimes are in your IS?
- What regimes are in your OOS?
If your OOS is one easy market, the test was decided before you ran it.
Put it over a stretch that actually hurts, and let the IS take both ends.
An out-of-sample test is only as hard as the market you put in it.

Same guys that grid searches every parameter, posts the best backtest, and sells it as a strategy to promote their algo trading school...
The only useful thing you can use it for, is to find the pass rate of evals if you're looking to trade Propr or some futures prop firms
This is the core of momentum. Rising prices pull in more buyers, trends persist longer than they “should,” and the strategy harvests that.
The occasional violent reversal is the risk premium you’re being paid to carry.
You went from sharpe 4.11 to 1.49
And it's only about 70 trades...
But at least now the results are reasonable and still good 👍
Finally someone on here who doesn’t blatantly grid search the parameters and curve fit the strategy just to promote some BS website
Monte Carlo can't tell you if that's an edge or the best result of a grid search. It just reshuffles the same trades.