

data + crypto = magic internet money
Joined February 2018
- Tweets170
- Following54
- Followers56
- Likes143

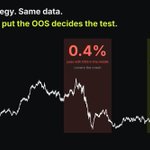




Most of you split your data the same way. First two thirds in-sample (IS), last third out-of-sample (OOS).
Then you check the IC, fwd return deciles, the Sharpe...
If the OOS numbers hold up, the strategy is "validated."
Here's how that goes wrong.
Hardly anyone checks what the market was actually doing in each part.
Say the first two thirds holds the crash, the chop and the slow bleed. The last third is one clean bull run.
You optimize on the hard part. Every parameter tweak that dodges a bad stretch pushes the IS Sharpe up. By the end, the model is great at surviving that one crash and that one chop.
Then it reaches the OOS. A bull run, where almost anything that's long makes money. It passes.
But the test never asked the real question: does this work in a hard market it wasn't tuned on? Every hard market went into the tuning. Only the easy one was left for the grade.
Before you look at a single metric, look at the chart:
- What regimes are in your IS?
- What regimes are in your OOS?
If your OOS is one easy market, the test was decided before you ran it.
Put it over a stretch that actually hurts, and let the IS take both ends.
An out-of-sample test is only as hard as the market you put in it.

Day trading doesn't work. At least not the version that gets pushed on social media.
Look at my banner. Thousands of traders flipping coins with zero edge. After a year, take the top 1%. They look like they've cracked the market, so they start posting, selling courses, running mentorships. In reality they just got lucky. The other 99% never post anything.
The worst part is the main message that gets pushed: it takes years and years to finally crack it. Just keep believing. So you keep buying evals, keep trying, keep paying subscriptions. That sentence isn't there to help you. It's there to keep you paying.
And it gets you hooked. It's an addiction. A random win now and then feels like proof you know what you're doing, every loss makes you think you did something wrong, and the next setup always looks like the one. Once you're in, getting out is almost impossible.
And the concepts themselves are BS. With ICT you can open any chart and explain every move after the fact. Liquidity got swept, CISD/BOS, price ran to the draw. In hindsight it all looks obvious.
Live, it's the same trap. When you win a clean trade, it feels like the concepts worked perfectly. When you lose, you always find something to blame: you missed this, that wasn't aligned, the HTF wasn't confirmed...
"The concept is never the problem. It's always you."
So I tested it. LRLR with an HTF DOL sweep, LTF sweep, CISD/BOS/IFVG entry. Perfected the rules so it would take the exact trades I would take live. Some trades worked perfectly. Some went straight to SL. Overall it was a coin flip with zero predictive power.
The clean ones are the screenshots you see. The ones that failed completely never get posted. Same in every mentorship: the top students post their wins and payouts, the losing ones stay quiet (my banner again). And with all that subscription money, a mentor can buy enough evals that one of them is basically guaranteed to pay out.
And if you keep losing money, they tell you trading is 90% psychology. It's you vs you. It's not. It's 100% strategy, and it's not you vs you. On the other side are billion-dollar institutions doing everything they can to keep price as precise and efficient as possible. No amount of discipline fixes a strategy with no edge.
I'm an ex day trader. I got a few payouts myself, and I can't honestly say they were more than luck. Since then I've tested many, many other concepts and features. Not one of them gave me a reliable edge.
Test any of it over thousands of trades and you'll see the same thing. Zero predictive power.
You're not going to beat one of the most efficient, liquid markets on earth by drawing boxes and lines on a chart.
So what does work?
Trading less liquid, less efficient markets. Finding an edge there is astronomically easier. Or taking a systematic approach to prop firms and using their payoff structure to make a profit.
Both come from testing and math.
But don't get me wrong. Sponsorships, mentorship money, YouTube ad revenue, referral links for evals... those all pay very well.
Combine that with young people who believe they're going to change their life, and a system built to keep them hooked and paying for years, and you've got the perfect business...

A chart pattern with no reason behind it is just noise that hasn't failed yet.
Most traders find the pattern first, then go looking for the reason. Quants do it backwards.
I built one idea that way and tested it. It showed up in 142 out of 142 sessions.
Here's the process 👇
Coffee is $3 downtown and $8 at the airport. Same coffee. The only difference is the buyers can't leave.
That's what an edge is: someone on the other side paying more than they should, for a reason they can't avoid. There are only three:
1. They're forced. Liquidation engines market-selling at any price. Desks rolling futures before expiry.
2. They're buying insurance. Traders overpaying for puts and vol into FOMC or CPI.
3. They're in a hurry. Every market order pays the spread and the taker fee to get filled now.
None of those are patterns. They're people with a reason.
Run the same test on your indicators. A moving average is arithmetic on old prices, and nobody's bonus depends on it. VWAP is the price big orders get graded against, so a desk buying size all day is actively trying to beat it. TWAP is the same idea on a clock: slice the order evenly through the day. One is math. The other has a person with an incentive behind it.
Once you have a reason, turn it into a question: when X happens, is Y different from the baseline? Condition, outcome, baseline. If you can't fill in all three, you don't have an idea yet.
Then, before you touch the data, write down what would prove you wrong:
- It disappears after costs
- It only works in one year
- It shows up just as strongly when your reason isn't there
Then run the test. If any of those show up, the idea is dead, no matter how good the reason sounded. If none do, you might actually have something.
Here's the one I tested. Big orders get sliced on a clock, so is there more volume at the top of every minute? On 142 sessions of index futures data, the first second of each minute had about 1.8x the volume of a normal second. Every single day.
Not a pattern. A schedule.
Crypto runs 24/7 and a lot of size moves through TWAP bots. Run the same test on BTC perps and tell me what you find.
Most ideas die at the prove-me-wrong step. That's the process working.
The idea isn't the edge. Killing bad ideas fast is.
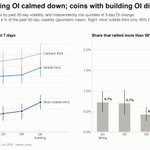
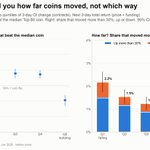
Does open interest predict where coins go next?
Traders swear by it: rising OI means new money and the move should run, falling OI means shorts covering and it should fade.
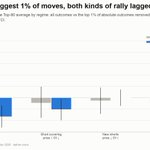
I tested 477 Binance perps, Feb 2022 to Jun 2026.

The direction signal, by contrast, flipped.
Long falling OI, short building OI, over 3 days:
2022: +35 bps
2023: −17 bps
2024: −12 bps
2025: −128 bps
2026 H1: −151 bps
That's what you'd expect if the short leg keeps getting caught in squeezes.

How I use heatmaps to avoid overfitting:
Split your data in two. One part you optimize on (in-sample). The other you lock away and don't touch until the end (out-of-sample).
Run your parameter grid on IS. Then, instead of picking the single best cell, average each cell with its neighbors and pick the best average.
Why? One great cell surrounded by bad ones is usually luck. A cell whose whole neighborhood performs well is much more likely to hold up.
Then run the same grid on OOS and check whether that area still looks good.
If it does, you might have a real edge.
If it falls apart, you were fitting noise, and it's better to learn that now than with real money.
This is what a robust strategy's heatmap should look like:

There are only 4 ways to actually make money in markets:
- Provide a service (market making)
- Harvest a risk premium (ERP, index beta)
- Know something first (informational edge)
- Exploit how the market is mechanically wired (structural edge)
That's it. That's the list.
If you can't put your strategy in one of those buckets, you don't have an edge.
Prove me wrong if you can.
Survivorship bias is probably the most common way people fool themselves in a backtest. Especially in crypto.
If you're testing on coins that are listed on Binance today, you're testing on survivors. Dozens of tickers have been delisted over the past few years (dead volume, regulation, or the project just quietly stopped existing).
Your strategy would have bought those. It might have held them all the way down. But they never show up in your equity curve, because they're not in the data you pulled.
Same trap with "top 20 by market cap." Today's top 20 is the list of coins that made it. The 2021 top 20 looked nothing like it. Plenty of those names aren't even top 100 now. Run your backtest on the current list and you're selecting winners you had no way of identifying in advance.
The result is always the same: the backtest looks better than the strategy is.
The fix is easy. Use data that includes delisted assets.
This image is the classic version of the same mistake. WWII analysts mapped bullet holes on returning bombers and wanted to armor the red areas. Abraham Wald pointed out the obvious thing nobody had said: those are the places a plane can get hit and still come home. The planes hit in the engines and cockpit weren't in the dataset. They never landed...
Your delisted coins are the missing planes.

Added a new strategy to my portfolio yesterday with a 2.24 sharpe, 0.52 correlation to the book.
It's a market neutral, made up of cross-sectional idiosyncratic momentum + a secondary signal.
Parameters were chosen in-sample. Both signals held up clean out-of-sample.
Higher correlation than i'd like, but it clears the bar. The test isn't whether correlation is low though, it's whether sharpe beats correlation × book sharpe.
Book's around 3, so the bar was 1.56. it cleared. took the portfolio from ~3.0 to ~3.1.
Both signals have a real economic rationale for why they should make money, and it holds across almost any parameter choice -> not a curve-fit
That's the whole decision rule for adding a strategy and almost nobody uses it


been running this systematic portfolio on hyperliquid for 2 months now.
live's ahead of the backtest, partly because i modeled fees pessimistically.
added a new sleeve today 2.22 sharpe standalone, 0.52 correlation to the existing book. might write that one up


Beta-neutral strategy I've been building, running on Hyperliquid.
Up 24% in the last 5 weeks, max dd around 5%
Sharpe +2.89 IS vs +3.11 OOS
Net of fees, slippage and funding
$3k equity, that's the actual problem, alpha doesn't wait around while you find capital.
What do I do?

ALT hyperliquid portfolio dashboard