

Trader. Nature Lover. Chart enthusiast. Head of Technical Research & Strategy @SchwabResearch & Contributor @SchwabNetwork Imp Discl: https://xitter.cf/t.co/wYzhxp2xt6
Joined August 2025
- Tweets3.7K
- Following218
- Followers11.9K
- Likes3.9K





Pinned Tweet
My new weekly article, "Technical Analysis Weekly" made its debut this afternoon!
Read here weekly: schwab.com/learn/story/techn…
Going forward, this weekly article will be published mid-morning on Monday's on Schwab.com
Truly a dream of many years that has come true! 🙌 Thank you Lord and thank you @SchwabResearch 🩵

I joined @SchwabNetwork today to discuss the technicals in #SPX as well as #Financials stocks #MA #BLK
schwabnetwork.com/video/char…
*Schwab does not recommend the use of technical analysis as a sole means of investment research
*All names and market data shown below are for illustrative purposes only and are not a recommendation, offer to sell, or a solicitation of an offer to buy any security

Rachel Dashiell, CFP, CMT retweeted
My new weekly article, "Technical Analysis Weekly" made its debut this afternoon!
Read here weekly: schwab.com/learn/story/techn…
Going forward, this weekly article will be published mid-morning on Monday's on Schwab.com
Truly a dream of many years that has come true! 🙌 Thank you Lord and thank you @SchwabResearch 🩵
Chart of the day: $MoveIndex and $VIX
The 3-month rolling correlation between $MOVE Index (bond market volatility) and $VIX (equity market volatility) is beginning to revert from an uncorrelated extreme.
Market participants may be watching #VIX closely as the relationship between #VIX and #MOVE appears to be showing early signs of convergence.
*Past performance is no guarantee of future results
*Schwab does not recommend the use of technical analysis as a sole means of investment research
*All names and market data shown below are for illustrative purposes only and are not a recommendation, offer to sell, or a solicitation of an offer to buy any security
*Chart source: thinkorswim


$MOVEIndex and $VIX have reached a near-zero 3-month rolling correlation.
The two volatility measures have become notably decoupled, with bond-market volatility currently moving very differently from equity-market volatility.
Historically, periods of pronounced divergence between the two have eventually been followed by a re-coupling, although the direction and timing are not implied.
The $MOVE Index can sometimes lead $VIX, making the relationship worth watching for signs of a potential shift in equity-market volatility.
*Past performance is no guarantee of future results
*Schwab does not recommend the use of technical analysis as a sole means of investment research
*All names and market data shown below are for illustrative purposes only and are not a recommendation, offer to sell, or a solicitation of an offer to buy any security
*Chart source: thinkorswim


Chart of the day: #Russell1000 #Growth vs #Value
#Growth relative to #Value appears to be testing a potentially important support zone that has been monitored over the past several years and aligns with prior cycle highs.
Since 2024, this polarity zone has coincided with periods where relative performance stabilized before improving in favor of growth. However, past performance is no guarantee of future results.
This relative relationship also appears to be forming a potential multi-year head-and-shoulders pattern. If this support zone fails to hold, some technicians may interpret it as evidence of a potential shift in leadership away from growth and toward value, which could influence the broader market backdrop.
*Technical patterns are subject to failure
*Schwab does not recommend the use of technical analysis as a sole means of investment research
*All names and market data shown below are for illustrative purposes only and are not a recommendation, offer to sell, or a solicitation of an offer to buy any security
*Chart source: thinkorswim

Russell 1000 $Growth Index vs Russell 1000 $Value Index
This seems like a pretty important chart going into 2026.... Is it time for Value to outperform?
@SchwabTrading @SchwabNetwork
*Not a recommendation

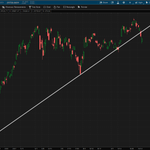
Looking across multiple time frames, a few potential areas may be worth monitoring in the primary trend of #NDX #Nasdaq100.
1-Year Chart: The #NDX is on pace for a second consecutive close below rising trendline support drawn from the March 2026 corrective lows. Technicians may monitor this former support area as a potential resistance zone following the breakout. Some technicians may view this development as an early indication that the character of the prevailing uptrend is changing.
3-Year Chart: Extending the trendline back to the 2025 correction lows highlights a longer-term area of confluence. The potential neckline associated with a developing double-top formation may become an important level for technicians to monitor, as it aligns closely with the longer-term rising trendline.
This illustrates why many technicians use a multiple time-frame approach. Developments seen on shorter-term charts can sometimes emerge before they become evident in the longer-term primary trend.
*Technical patterns are subject to failure
*Schwab does not recommend the use of technical analysis as a sole means of investment research
*All names and market data shown below are for illustrative purposes only and are not a recommendation, offer to sell, or a solicitation of an offer to buy any security
*Chart source: thinkorswim


After printing a failed breakout last week, #Technology relative to #SPX appears to also have lost rising trendline support.
Following the #Tech weakness, former relative highs from last October may be a key area of focus for technicians.
*Schwab does not recommend the use of technical analysis as a sole means of investment research
*All names and market data shown below are for illustrative purposes only and are not a recommendation, offer to sell, or a solicitation of an offer to buy any security
*Chart source: StockCharts.com

Chart of the day: #Technology vs #SPX
One relationship some technicians may be watching when assessing potential risks within the equity market is Tech relative to the S&P 500.
Following a breakout to new relative highs versus the S&P 500, #Technology has begun to show signs of a potential failed or early breakout. This comes as the MACD indicator is approaching a potential bearish crossover.
Given #Tech's significant weight within the major indexes, some technicians may monitor whether continued relative weakness, alongside subdued breadth conditions, coincides with broader market weakness.
That said, technicians may be looking for additional follow-through in the coming sessions before viewing the recent move as a confirmed breakdown.
*Schwab does not recommend the use of technical analysis as a sole means of investment research
*All names and market data shown below are for illustrative purposes only and are not a recommendation, offer to sell, or a solicitation of an offer to buy any security
*Chart source: StockCharts.com

The #USDollarIndex is on track for two consecutive weekly closes above the 38.2% Fibonacci retracement of the 2025 decline.
Weekly momentum, as measured by the Moving Average Convergence Divergence (MACD) indicator, appears to be diverging slightly from price.
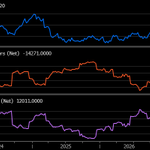
Positioning data in $DX_F also appears to be diverging from recent price strength. Commercial hedgers remain near relatively elevated net short positioning levels compared with much of the past three years, while large speculators have reduced exposure from previously elevated net long levels.
Taken together, price, momentum, and positioning are sending mixed signals that technicians may continue to monitor.
*Schwab does not recommend the use of technical analysis as a sole means of investment research
*All names and market data shown below are for illustrative purposes only and are not a recommendation, offer to sell, or a solicitation of an offer to buy any security
*Chart sources: thinkorswim and Bloomberg


Last week in our "Trading Price Patterns" webcast, we discussed trading failed patterns placed an example simulated paper-trade on $TER when it entered back into the triangle pattern.
This morning we took roughly an 80% profit on our example trade as price reached the lower boundary of the coil.
This is an example of how failed moves in classical patterns may result in fast moves in the opposite direction.
youtube.com/watch?v=4svUpyfR…
*Past performance is no guarantee of future results
*Schwab does not recommend the use of technical analysis as a sole means of investment research
*All names and market data shown below are for illustrative purposes only and are not a recommendation, offer to sell, or a solicitation of an offer to buy any security
*Chart source: thinkorswim


#Discretionary relative to #Staples is sitting on support near yearly lows 👀
Chart of the day: #Nasdaq100
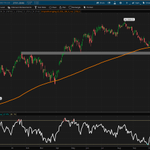
#NDX gapped through multiple versions of trendline support today.
Technicians may be monitoring how quickly these gaps get filled (if at all) to provide an indication of the strength of the underlying trend.
*Schwab does not recommend the use of technical analysis as a sole means of investment research
*All names and market data shown below are for illustrative purposes only and are not a recommendation, offer to sell, or a solicitation of an offer to buy any security
*Chart source: thinkorswim


Speaking of ranching, he was on Yellowstone too! Great guy! @ScottDurfeyCS

Let's get the man, the myth, the legend @ScottDurfeyCS some followers. He's top notch when it comes to markets and ranching.
Today I joined “The Watch List” on @SchwabNetwork to discuss the technical levels in #SPX #JPM #CAT
*Schwab does not recommend the use of technical analysis as a sole means of investment research
*All names and market data shown below are for illustrative purposes only and are not a recommendation, offer to sell, or a solicitation of an offer to buy any security
schwabnetwork.com/video/char…

Chart of the day: $CrudeOil
Point & Figure analysis of #CrudeOil identifies a measured objective near $111 based on the chart's methodology.
This tentative price level aligns with the upper bounds of #Oil's rising channel.
*Price objectives are not guaranteed to be met and technical patterns are subject to failure.
*Schwab does not recommend the use of technical analysis as a sole means of investment research.
*All names and market data shown below are for illustrative purposes only and are not a recommendation, offer to sell, or a solicitation of an offer to buy any security.
*Chart sources: StockCharts.com and thinkorswim


#CrudeOil is on track for 5 consecutive daily up-closes on 4 days of consecutive lower-than-average volume days FYI
S&P 500 sectors relative to #SPX on a 6-month time frame
What stands out to you?
*Schwab does not recommend the use of technical analysis as a sole means of investment research
*All names and market data shown below are for illustrative purposes only and are not a recommendation, offer to sell, or a solicitation of an offer to buy any security
*Chart source: thinkorswim
