

Chief Economist @OpenBrandAI. Formerly @haus, @trulia, @corelogic, and @realtordotcom. FAA Certified Flight Instructor and Commercial Pilot.
Groveland CA
Joined April 2013
- Tweets6.7K
- Following812
- Followers3.7K
- Likes1.3K

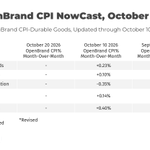

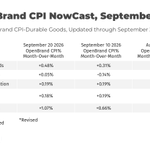

Durable goods price growth has slowed sharply so far in October. The OpenBrand CPI NowCast shows the OpenBrand CPI for Durable Goods up +0.23% month over month through October 10. That is about a third of September's revised +0.68% gain.
All four product groups are cooling, and Communication has turned negative:
-Recreation: +0.40%, down from +1.52% in September. This is still the fastest-growing group, but the slowdown is the biggest of the four.
-Home Improvement: +0.14%, down from +0.46%.
-Appliances: +0.10%, down from +0.14%. This group was already growing slowly, so its change is the smallest.
-Communication: -0.35%, down from +0.62%. It is the only group where prices are falling.
The Gist: after a strong September, early October looks like a turn toward cooler durable goods inflation, with phones, computers, and tablets leading the way. The Communication drop lines up with early-October promotions, but these numbers only cover part of the month and may be revised.
The next NowCast update, through October 20, will show whether the slowdown holds. All figures are seasonally adjusted.

Prices of durable home and tech goods are running hotter than the BLS' headline durables number.
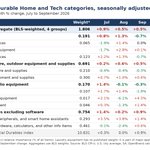
Using the September BLS CPI, I built a BLS-weighted aggregate of four durable product groups: appliances; tools, hardware, outdoor equipment and supplies; video and audio equipment; and IT commodities excluding software.
Seasonally adjusted, that aggregate rose 0.9% in July, 0.5% in August, and 0.5% in September. That is a 7.5% annualized pace over three months.
What's driving it:
-Computers, peripherals, and smart home assistants: up 40.5% annualized, the biggest single driver
-Outdoor equipment and supplies: up 9.7% annualized
-Other appliances (small electrics and floor care): up 11.8% annualized
-Major appliances (down 2.1%) and telephone hardware (down 7.8%) moved the other way
Two reasons I read the BLS figures as a floor on what shoppers are actually paying:
(1) Timing. BLS brings new products in mainly through sample rotation, which fully turns over every four years, so a new model can take a year or more to enter the index. At OpenBrand, new products enter our CPI after a two-month seasoning period.
(2) Hedonic adjustment. When a sampled item is replaced, BLS can lower measured price change to account for new features. In this basket, that applies to refrigerators, washers and dryers, ranges, microwaves, and phones. It is a reasonable cost-of-living method, but it can make inflation look lower than the price on the shelf. Notably, major appliances and telephone hardware, both hedonically adjusted, are the categories posting declines.
The takeaway: price pressure in durable Home and Tech goods is broadening beyond computers, and shelf prices are telling a firmer story than the official numbers.
#OpenBrand #CPI #Inflation #DurableGoods #ConsumerElectronics #Appliances

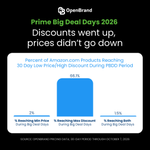
During Prime Big Deal Days last week, 66.1% of Amazon.com products hit their deepest discount of the past 30 days. Only 2.0% hit their lowest price. That gap is easy to read as sellers inflating prices before the event, and some probably did.
But there's more nuance in a higher-inflationary environment. Durable-goods prices are up 4.4% so far this year, the most since at least 2020. Tariffs went up in July, chip costs are higher, and retailers were already cutting back on promotions in September.
When list prices are going up, a seller can offer its biggest discount of the month and still end up above where the price was a few weeks ago. The discount is real. It just doesn't take the price as low as it used to. We're digging into the SKU-level data to separate cost pressure from deal setup. I'll share what we find.
Full analysis: lnkd.in/gHzV7Z2g

We have a tale of two reads on the September OpenBrand CPI report.
Read #1: The month. The OpenBrand CPI of Durable Goods rose +0.54% in September, slowing from a revised +0.67% in August. Three of our four product groups slowed. That looks like relief is possibly on our doorstep.
Read #2: The year. From January through September, durable goods prices are up 4.4%. That's the biggest September year-to-date gain since at least 2020. It beats 3.0% over the same months in 2025 and the previous high of 3.5% in 2022. That doesn't look like relief.
The split shows up in the product groups too:
• Recreation: +9.3% YTD, and still speeding up (+1.36% MoM). Media players are up 12.3% and headphones 10.8%.
• Home Improvement: +3.7% YTD
• Communications: +3.5% YTD
• Appliances: +0.7% YTD, the only group under 1%
Three things have helped push prices higher this year: the lingering effects of tariffs, oil near $100, and a memory chip shortage as AI data centers pull supply away from consumer electronics. Discounts also got smaller and less frequent in September.
The takeaway is that while there are signs of cooling in September, this year's trend still points up.
Full report: lnkd.in/ggFX4xpW
#Inflation #CPI #DurableGoods #Economics #Retail

Consumers are still driving volume gains in our BEA-based Home and Tech Market Size basket by buying more, not paying more, with one big exception: computers.
This is part of my regular monthly commentary on trends in OpenBrand's Home and Tech basket, derived exclusively from the BEA Personal Income and Outlays monthly release.
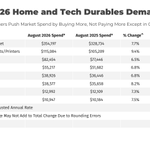
Spending on the seven-category basket reached $354.2B (seasonally adjusted annual rate) in August 2026, up 7.7% from a year ago. Of the $25.5B increase, about $22.5B (+6.9%) came from more units and only about $2.9B (+0.9%) from higher prices.
Category highlights, year over year:
Major appliances: units +8.5%, prices -1.9%. Shoppers are paying less per unit and buying more.
Televisions: units +9.3%, prices -1.0%. The familiar TV pattern continues.
Outdoor equipment: units +7.1%, prices +0.4%. The cleanest demand signal in the basket.
Small appliances: units +5.9%, prices +1.3%. Modest, balanced growth.
Tools & hardware: units +4.0%, prices +2.8%. The home category where price is doing the most work.
Phones: units +24.3%, prices -14.1%. BEA's price index is quality-adjusted, so part of that decline reflects better devices at similar prices.
Computers & tablets: units +0.9%, prices +8.4%. The outlier. Its price contribution is roughly three times the basket's net price gain, so excluding computers, basket prices would be lower than a year ago.
What this means: consumers continue to show resiliency by driving year-over-year growth through volume, but price pressure is concentrated in computers and, to a lesser extent, tools and hardware. Durable goods are among the most rate-sensitive purchases, so the housing-linked categories are the ones I'll be watching most closely in the months ahead. If prices keep rising while volume softens, dollar growth will overstate the real health of these categories, so it pays to track units, not just dollars.
Note: this release included BEA's annual update, so year-ago comparisons reflect revised data.
#OpenBrand #ConsumerSpending #BEA #DurableGoods #HomeAndTech

The OpenBrand CPI NowCast through September 20th is out. Durable goods inflation continues to show volatility at the product group level, with prices of both appliances and recreation goods accelerating in the middle third of the month. That said, the price growth trend has decelerated from August across all of our product groups.

Is inflation finally trickling down to durable goods? The signals are mixed.
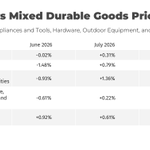
Headline durable goods CPI has looked flat in two of the past three months (Jun: −0.02%, Jul: 0.31%, Aug: 0.01%), but the aggregate number is hiding a sharp divergence underneath.
Appliances just swung from a −1.5% drop in June to +1.3% growth in August.
Tools, hardware, and outdoor equipment are building price growth momentum as well: three consecutive months of accelerating gains (−0.6% → 0.2% → 0.6%).
Meanwhile, information technology commodities spiked in July (+1.4%) but cooled fast in August (+0.1%), and recreation commodities growth is decelerating toward flat. So it's not a uniform durable goods story — some categories are heating up while others lose steam.
What's likely behind some of the acceleration: a Section 232 tariff expansion effective April 7, 2026 put a 25% ad valorem duty on the full value (not just steel/aluminum content) of a long list of household appliances, hand tools, hardware, and outdoor power equipment — refrigerators, washers, dryers, dishwashers, lawn mowers, chain saws, hinges, fasteners, and more. That's the same set of HTS codes underlying both the appliances and tools/hardware/outdoor equipment CPI series, which lines up neatly with why those two categories — and not durable goods broadly — are the ones accelerating.
Energy doesn't look like the driver here. Seasonally adjusted CPI energy actually fell in June (−5.7%) and July (−1.5%) before rebounding in August (+2.1%) — a mild net tailwind for input/shipping costs over the window, not a headwind, though rising diesel prices of late are likely to impact the trajectory going forward. IT commodities and recreation goods, which are less exposed to these particular tariff lines, show more muted or decelerating price action, consistent with a targeted tariff effect rather than broad-based cost pressure feeding through to durable goods overall.
Bottom line: this looks less like inflation "trickling down" everywhere and more like isolated tariff pass-through hitting a specific slice of the durable goods basket.

Durable goods price growth cooled again in August, but beneath the headline number, retailers are getting much more surgical with their discounts.
Our August 2026 OpenBrand CPI – Durable Goods report is out. Here's what stood out: Overall prices rose +0.57% month-over-month, down from a revised +0.86% in July. Three of our four product groups decelerated — only Appliances (+0.23%) accelerated, while Communication (+0.18%), Home Improvement (+0.47%), and Recreation (+1.22%) all cooled.
Back-to-school drives the story this month. Discounting across Monitors, Notebooks, Smartphones, Tablets, TVs, and Wearables has become uneven, with TVs seeing the heaviest promotion and Monitors the sharpest increases in discounts.
However, overall frequency is down from prior years. The gist is that value hasn't disappeared, but it's become concentrated in fewer products, retailers, and windows.
Full breakdown, category-level detail, and methodology in the report:
openbrand.com/newsroom/blog/…
#ConsumerPriceIndex #DurableGoods #RetailPricing #Economics #Appliances #ConsumerElectronics


Ralph B. McLaughlin retweeted

August durables prices rose +0.57%, down from +0.86% in July. Growth is cooling, but it hasn't stopped.
What stood out to me is where the discounts went. Back-to-school promotions were narrower than usual, concentrated in a handful of categories like TVs and monitors while most of the shelf stayed quiet. Retailers are getting selective about where they spend margin.
That is the signal worth watching heading into holiday.
hubs.ly/Q04wYJXb0

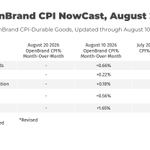
Ahead of the BLS CPI report for July this morning, we release the OpenBrand CPI NowCast through the first 10 days of August. The highlight? A slight moderation of durable goods price growth to +0.66% from +0.86% the month prior.
A deceleration in price growth occurred in both communications and home improvement product groups. Appliances and recreation were essentially flat.
Stay tuned for our next NowCast update on August 21.

Tariffs are starting to show up in appliance prices. Demand? Not yet.
Our July OpenBrand CPI just posted one of the sharpest increases in durable goods prices in months. Durable goods prices rose +0.83% month-over-month, up from +0.65% in June, with all four product groups posting gains, and three of four accelerating.
Appliances were a standout, swinging from -0.02% in June to +0.14% in July on a seasonally adjusted basis. This is our largest SA increase since January. On a non-seasonally adjusted basis, it's the biggest monthly jump since May of last year.
The likely culprit: the April 6 change to Section 232 tariffs, which now applies to an appliance's entire price rather than just its steel and aluminum content. For categories like refrigerators, dishwashers, and washers, that's a meaningful cost shift for manufacturers to absorb or pass along.
An interesting take is that demand hasn't cracked yet. BEA's Appliance Quantity Index and Census retail sales both show the usual up-down-up churn since April, not a sustained pullback. The softness we do see in building materials looks tied to a sluggish housing market (existing-home sales fell 2.4% in June) rather than tariff pass-through.
Elsewhere: Home Improvement (+1.23%) and Recreation (+1.67%) both accelerated, while Communication (+0.27%) cooled as Apple's list-price hikes reset the shelf-price baseline. Overall discounting pulled back too as both frequency and magnitude of promotions declined for the second straight month.
My read: we're watching a real-time test of tariff pass-through before it shows up in the official BLS data. Full breakdown and macro outlook in the July report.
openbrand.com/newsroom/blog/…


Here's my regular monthly read on OpenBrand's Home and Tech basket, built exclusively from the BEA Personal Income and Outlays monthly release. It shows real demand continues to buoy up market size growth of home and tech durable goods.
The seven-category basket reached $355.4B at an annual rate in June 2026, up $4.5B from May (+1.3%).
Quantity contributed about $6.3B to the monthly increase (+1.8%), while lower pricing subtracted about $1.8B (-0.5%). That means June's gain was strongly volume-led rather than price-led.
Computers, tablets, and peripherals remained the biggest dollar driver. Major appliances, TVs, and phones also contributed to the month. Outdoor equipment grew modestly, with real demand helping offset softer pricing.
For brands and retailers watching the home and tech consumer, the takeaway is straightforward: June's growth was more demand-led than price-led and remains robust despite an uncertain trajectory for energy prices.

Ralph B. McLaughlin retweeted
Ralph McLaughlin and I are back for the Q3 State of Durables update.
We spent this one digging into the Q2 macro backdrop, and the story kept coming back to energy.
Back in April we said energy would drift lower, not spike. That mostly held, and we see oil settling in the $70 to $80 range. But here's what gets missed: even when energy eases, consumers don't feel it right away. Gas prices climb like a jet and fall like a parachute.
That lag is why retailers leaned so hard on discounting. Memorial Day promotions held our Durable Goods CPI nearly flat in May. Then Prime Week flipped it in June, pushing the CPI up around 0.8 percent. Two events, two playbooks. One flattened inflation, the other redirected it into pricier goods.
My takeaway: promotions are now central to how people actually experience inflation in durables. If energy stays contained and housing improves, 2027 might finally look like a normal year.
Watch the full video: hubs.li/Q04q8-H50
Ralph B. McLaughlin retweeted

Excited to share that OpenBrand's Chief Economist, @RB_McLaughlin, will take the stage at the 2026 HIRI Home Improvement Insights Summit on September 29 in Minneapolis.
Register with code SAVE50 to save $50 (new registrants only, expires 8/31): hubs.li/Q04prDwB0

My regular monthly read on OpenBrand’s Home and Tech basket, built exclusively from the BEA Personal Income and Outlays monthly release, shows continued market size growth in May, but with a mix driven more by price than by quantity.
Our seven-category basket reached $350.5B at an annual rate in May 2026, up $1.8B from April and $27.4B from a year ago.
The composition of growth shifted: quantity accounted for about $0.6B of the monthly increase, while price accounted for about $1.2B. That means May’s gain was still positive, but more price-supported than volume-led.
Computers, tablets, and peripherals were the biggest dollar driver. TVs and outdoor equipment showed a healthier quantity growth. Major appliances grew in dollars, but the move was more price-led. Computers, tablets, and peripherals and small appliances were the heavy percentage drivers.
For brands and retailers watching the home and tech consumer, the signal is that the market is still expanding, but it is now being driven more by price than quantity.
#OpenBrand #ConsumerSpending #BEA #PersonalConsumptionExpenditures #HomeAndTech

Today we release the May 2026 OpenBrand CPI - Durable Goods report, and find that price growth slowed unexpectedly in May.
Here are the key findings:
Price growth of the OpenBrand Durable Goods basket slowed to just +0.02% month-over-month, down sharply from a revised +0.43% in April, as heavy Memorial Day promotions weighed on overall movement.
Home Improvement saw one of the sharpest Memorial Day promotional spikes, with discount frequency climbing from 13.4% to 20.3%.
Three of the CPI product groups declined month-over-month: Appliances (-0.04%), Communications (-0.35%), and Home Improvement (-0.33%).
Appliances reversed last month's return to growth, dipping back into negative territory despite a reduction in both discount frequency and magnitude, suggesting shelf price adjustments may be at play.


This is the first in what will be a regular monthly commentary on trends in OpenBrand's BEA Home and Tech basket market size, which we derive exclusively from the BEA Personal Income and Outlays monthly release.
The first read, using the BEA’s April 2026 data, shows a surprising trend: the seven-category OpenBrand Home and Tech basket reached $348.0B at an annual rate, up $3.2B (+0.9%) from March and $24.0B from a year ago, driven largely by real demand rather than price.
The important part is the mix of price vs. quantity. Quantity contributed about $2.4B of the monthly increase (about +0.7%), while price contributed about $0.8B (about +0.2%). That means the move was not just inflation or price mix; real demand did most of the work.
Computers and tablets were the largest dollar driver, with televisions, appliances, and phone-related equipment also contributing. Tools and hardware are worth watching because the dollar gain came from quantity, while price moved lower.
For companies tracking the home and tech consumer, this is the key signal from the BEA release: demand is still expanding, but the quality of growth varies by category.
#OpenBrand #ConsumerSpending #BEA #PersonalConsumptionExpenditures #HomeAndTech
