RSA Fellow; Author; Advisory Board Member; Datavis Lead @google; I love visual languages, design systems, data accessibility, Legos and architecture.

Philadelphia, PA
Joined February 2009
Curious about how to write effective alt text for charts and graphs? My colleagues and I recently contributed some new guidleines for Material Design. Check it out: m3.material.io/foundations/c… #DataVisualization #Datavis #DataAccessibility #A11y #MaterialDesign
1
1
172
Thanks for the shout-out @smashingmag! It's been an honor sharing UX articles that focus on topics like #datavisualization, #accessibility and #architecture over the past 10 years.
Our Person of the Week is a Datavis Lead at Google, passionate about visual languages, design systems, and data accessibility. Please give a warm round of applause for... Kent Eisenhuth! Thank you for everything you do for the community, dear @KentTheHuth! #smashingcommunity
1
6
352
Our Person of the Week is a Datavis Lead at Google, passionate about visual languages, design systems, and data accessibility. Please give a warm round of applause for... Kent Eisenhuth! Thank you for everything you do for the community, dear @KentTheHuth! #smashingcommunity
2
1
8
6,904
I had a blast sharing a talk on the importance of #datavisualization and #accessibility to a hall full of design, computer science, business and psychology students at @BrownUniversity today. I especially enjoyed the discussion at the end. The students' energy was incredible!
116
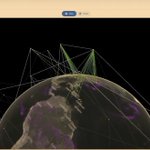
I'm excited to return to Philly to share a brand new @DataVizSociety talk, Storytelling with AI and Pictures: A Tale of Connectivity in Outer Space. If you like #storytelling, #space travel, #satellites, #lasers, #MachineLearning and #datavis, then this talk is for you! meetup.com/philadelphia-data…
1
98
Kent Eisenhuth retweeted
And some useful resources on accessible data visualization: ✢ An intro to designing accessible data visualizations - @sarahfossheim fossheim.io/writing/posts/ac… ✢ Which fonts to use for your charts and tables - @lisacmuth blog.datawrapper.de/fonts-fo… ✢ What to consider when using text in data visualizations- @lisacmuth blog.datawrapper.de/text-in-… ✢ An Accessibility-First Approach To Chart Visual Design - @KentTheHuth and @syntagmatic smashingmagazine.com/2022/07… ✢ How to choose an interpolation for your color scale -@lisacmuth blog.datawrapper.de/interpol…
1
3
1
7
837
Join me for a @RethinkTalks workshop on all things #Datavis. This includes an intro to human perception, chart usage, designing dashboards, datavis in the age of #AI and #accessibility. rethinkhq.com/programs/story…
1
115
Thanks @UU_UXpodcast for a great discussion on accessible data visualization, my book, Drawing Product Ideas, and much more!
How can #product & #ux #designers ensure that #data #visualisations are accessible to #users in all contexts? How can #AI help designers make better, more #accessible choices for visualising data? Author, speaker and Design Lead @KentTheHuth from #google shares his wisdom🎧🎙
2
225
How can #product & #ux #designers ensure that #data #visualisations are accessible to #users in all contexts? How can #AI help designers make better, more #accessible choices for visualising data? Author, speaker and Design Lead @KentTheHuth from #google shares his wisdom🎧🎙
1
1
1
1
397
In honor of #GAAD2023, here are some accessible datavis resources created by my colleagues and I: Material Design's Top Tips For Data Accessibility material.io/blog/data-visual… An Accessibility-First Approach to Chart Visual Design (@smashingmag Case Study) smashingmagazine.com/2022/07… It's Data Accessibility, Not Data Visualization. (ISVIS 2022) youtube.com/watch?v=WlyADrqb…
1
2
159
So excited to see data accessibility getting some love in the next issue of Nightingale! Looking forward to the article @DataVizSociety
This Post is from an account that no longer exists. Learn more
2
463
Big thanks to @DataVizSociety and @OutlierConf for inviting me to speak at #outlier2023. It was an honor to share our lessons learned from our accessibility-first approach to #datavis. #inclusivedesign #a11y #dataaccessibility #Datavisualization
1
1
7
713
I had a wonderful evening sharing my data accessibility talk and more about my book, Drawing Product Ideas, at @VillanovaU this week. Thanks to the students and faculty for one of the best Q&A sessions I've ever had! #DataVisualization #DataAccessibility #UX #DesignThinking #DrawingProductIdeas
3
128
Had so much fun discussing all things datavis and my book, Drawing Product Ideas with @jpang0811 and the @ixda_sydney team! Also mad props to @yang140 and my other colleagues who wrote the guidelines with me.
2
164