

Partner @ Euphrates Ventures ; Telecom ; Internet ; Technology; Business; Kurdistan; Iraq
- Tweets2.4K
- Following945
- Followers2K
- Likes1.4K
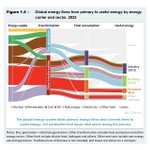



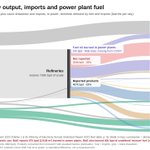


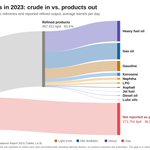


ALT Sankey diagram of Iraq's 2023 fuel flows in barrels per day, combining COSIT's Commodity Balances Report 2023 and the Ministry of Electricity's 2023 annual report. Left: crude to power plants 199,263 bpd, crude to refineries 739,164, stock drawdown 37,336, product imports 149,659. Refineries split into fuel oil burned in power plants 67k bpd (MoE data, missing from COSIT), 204k not reported as products (28%) and 467k reported products (63%). Right: power plants 266,620 bpd (crude plus fuel oil), still not reported 204,396, exports 191,754 (85% fuel oil). Domestic demand by fuel with share made in Iraq: fuel oil 13,948 as recorded by COSIT, jet fuel 3,520 (90%), LPG 14,620 (88%), gas oil and diesel 163,045 (86%), asphalt 6,179 (85%), lubes and wax 1,221 (49%), gasoline 194,740 (45%), kerosene 65,378 (42%). MoE also burned 40k bpd of undefined mixture fuel, not shown. Unreported volume is a calculated difference, not a measured loss.


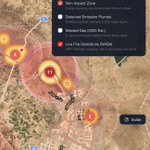
ALT Iraq Flaring Watch dashboard showing a popup card for West Qurna 2-Yamama oil field. The popup reads: LUKOIL flared 2,755 million m³ of gas in 2025 — capturing it could have generated ~$340.6M USD, enough to power ~2.4M Iraqi homes. The sidebar shows national stats: 417 active flares, 24 fields, ~$2.98B gas value wasted, ~24 BCM annual flaring volume, ~4,241 MW electricity generation potential, and ~5.1 Million Iraqis living within 5km of a flare. Purple economic waste bubbles and a cyan emission plume dot are visible on the OpenStreetMap background near West Qurna, southern Iraq.


