

Tracking gas flaring across Iraq 🔥 Active flares · Emission plumes · Economic waste · Data: @OpenStreetMap @WorldBankData @CarbonMapper @NASA | by @rawaz
- Tweets23
- Following4
- Followers31
- Likes0


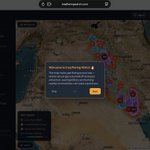


ALT National-scale view of Iraq Flaring Watch showing gas flaring across the entire country on satellite imagery. Dozens of bright red squares are scattered across Iraq marking NASA VIIRS satellite fire detections from the last 3 days, densely concentrated in the northern oil regions around Mosul, Kirkuk and Maysan, and heavily clustered in the southern Basra oil fields near the Kuwait border. Orange dots with numbers indicate clustered community-mapped flare locations from OpenStreetMap.

ALT Iraq Flaring Watch web map showing near real-time NASA VIIRS fire detections over an oil facility near Basra, Iraq (coordinates 30.82974, 47.32937). Several bright red squares are scattered across high-resolution satellite imagery, each marking a thermal hotspot detected by satellite within the last 3 days. Storage tanks, flare stacks, and dark scorch marks are visible on the ground beneath the detections. An open popup card titled "VIIRS Fire Detection" shows details for one hotspot: detected 2026-08-09 at 22:31 UTC, confidence Nominal, fire radiative power 8.74 MW, sourced from NASA FIRMS / VIIRS SNPP. The Display Layers panel on the right shows "Live Fire Detections (NASA)" toggled on, with all other layers — Active Flare Locations, Flare Density Map, 5km Impact Zone, Detected Emission Plumes, and Wasted Gas — toggled off. The dark-themed interface header reads "Iraq Flaring Watch" with Background, Layers, Legend, and Guide controls around the map edges.


ALT Iraq Flaring Watch dashboard showing a popup card for West Qurna 2-Yamama oil field. The popup reads: LUKOIL flared 2,755 million m³ of gas in 2025 — capturing it could have generated ~$340.6M USD, enough to power ~2.4M Iraqi homes. The sidebar shows national stats: 417 active flares, 24 fields, ~$2.98B gas value wasted, ~24 BCM annual flaring volume, ~4,241 MW electricity generation potential, and ~5.1 Million Iraqis living within 5km of a flare. Purple economic waste bubbles and a cyan emission plume dot are visible on the OpenStreetMap background near West Qurna, southern Iraq.


ALT OpenStreetMap view of Kirkuk, Iraq showing active gas flare clusters around the Baba Gurgur and Kirkuk oil fields. Red dashed 5km impact circles overlap the city of Kirkuk, its international airport, and surrounding villages. A red-orange heatmap shows high flaring intensity concentrated in the western oil field area. Arabic and Kurdish place names are visible including كركووك (Kirkuk). Cyan emission plume dots are visible near the flare clusters. The map shows the proximity of industrial gas flaring to dense urban settlement.

ALT OpenStreetMap view of Basra, Iraq at medium zoom showing dozens of overlapping red dashed 5km impact circles around active gas flare markers. The circles cover dense residential neighbourhoods, major roads and urban areas surrounding the city. A heatmap shows high flaring intensity in red and orange concentrated around the Rumaila oil field complex to the west of the city. Cyan emission plume dots and purple economic waste bubbles are visible among the flare clusters. Arabic street and place names are visible throughout.

ALT OpenStreetMap view of Basra, Iraq showing dozens of overlapping red dashed circles representing 5km health impact zones around active gas flares. The circles cover large parts of the city including residential neighbourhoods and roads . Arabic place names are visible including البصرة (Basra), الزبير (Zubair) and surrounding areas. The sidebar shows 417 active flares nationally with 5.1 million Iraqis living within 5km of a flare.

ALT Iraq Flaring Watch just got smarter 🔥 The sidebar now shows what's really at stake: ~5.1 Million Iraqis live within 5km of an active gas flare ~$2.25B in gas value burned annually ~3,196 MW of electricity generation potential — wasted Full methodology, data sources & scripts 👇 https://github.com/rawazrauf/iraq-flaring-watch/blob/main/DATA_METHODOLOGY.md Explore the map 👇 iraqflaringwatch.com


ALT OpenStreetMap view of southern Baghdad, Iraq showing a gas flare popup card overlaid on a dense urban street grid. Arabic street names and the Tigris river are visible. The popup shows 558,831 people living within 5km of this active flare site — the highest population exposure of any mapped flare in Iraq. A red-orange heat density cluster and cyan emission plume dots are visible in the surrounding residential area near the Al-Dora district.

ALT Satellite map of the Rumaila oil field in Basra, Iraq showing a cyan emission plume marker indicating a CO2 detection of 1,815,622 kg/hr recorded on 25 December 2025 by Carbon Mapper. The popup card shows emission rate, wind speed, sector classification as Energy/Power, and a satellite plume detection image.

ALT Satellite map zoomed into West Qurna 2 oil field in Basra, Iraq. A large purple bubble dominates the view representing 1,642 million cubic metres of gas flared in 2024 by LUKOIL. The popup card shows the economic impact: approximately $202 million USD in value lost and enough electricity to power 1.6 million Iraqi homes for a year. Orange flare markers and cyan emission plume dots are visible in the surrounding area.

ALT High-resolution satellite image of an active gas flare stack in the Rumaila oil field, southern Iraq. An orange pulsing marker indicates the flare location, with a large purple economic waste bubble nearby showing annual gas volumes lost. A cyan emission plume dot marks a verified satellite detection. The flare infrastructure is clearly visible on the ground from space.
