

Connoisseur of Extreme Weather, Snow, Running, and Stock Market trends. Assistant Director/Precipitation Science @CW3E_Scripps/UCSD.
- Tweets6.8K
- Following94
- Followers1.8K
- Likes2.5K


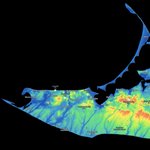
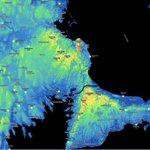


ALT Total estimated precipitation (in inches) during the 5-day period ending 5 am Pacific Time Thursday, October 15, 2026. Data source: NCEP Stage IV quantitative precipitation estimate product.


ALT Left image shows The North American Ensemble Forecast System (NAEFS) Integrated Vapor Transport percentile of climatology plot. Right image shows the Weather Prediction Center's 7-day total precipitation forecast valid 5 am Pacific Time on 15 October.


ALT Map of rainfall totals from the September 25-28, 2026 nor’easter across southern New England. The highest totals of 5-8 inches are concentrated across Rhode Island and southeastern Massachusetts, with several locations exceeding 7 inches and a maximum shown near 8 inches. Totals generally decrease to 2-5 inches across central Massachusetts and Connecticut and less than 2 inches across much of western Massachusetts.




ALT Maps depict Coastal Flood Forecast Points into Friday and Rainfall through this weekend.


ALT Multi-panel figure showing differences in 72-hour forecast precipitation accumulation (in millimeters; shaded as in legend) between re-forecasts using various bulk microphysics parameterization schemes and the re-forecast ensemble mean for a high-impact atmospheric river during 7-10 January 2017. Contours enclose departures from the Stage IV quantitative precipitation estimate exceeding the 75th percentiles of the overprediction (magenta) and underprediction (black) error distributions pooled across the ensemble. Because the thresholds are ensemble-relative rather than absolute, the contoured area is directly comparable between schemes. From Figure 5 in Smith et al. (2026).
ALT Multi-panel figure showing differences in 72-hour forecast precipitation accumulation (in millimeters; shaded as in legend) between re-forecasts using various bulk microphysics parameterization schemes and the re-forecast ensemble mean for a high-impact atmospheric river during 7-10 January 2017. Contours enclose departures from the Stage IV quantitative precipitation estimate exceeding the 75th percentiles of the overprediction (magenta) and underprediction (black) error distributions pooled across the ensemble. Because the thresholds are ensemble-relative rather than absolute, the contoured area is directly comparable between schemes. From Figure 5 in Smith et al. (2026).

ALT Left: NCEP GFS model integrated vapor transport (shading and vectors; units = kilograms per meter per second) and sea-level pressure (contours; units = hectopascals) forecasts initialized at 5 pm PT Tue 1 Sep and valid at 11 am PT Wed 2 Sep. Right: Multi-model ensemble forecast tracks and track density for Tropical Storm Marie. The probability of the storm center tracking within 150 kilometers of a given location is shown in the higher-opacity shading. Individual ensemble member forecast tracks are shown in thin grey lines, with the multi-model ensemble mean track represented by the thick black line. Ensemble mean forecast tracks from the Canadian model (CMC), European model (ECMWF), and U.S. model (GEFS) are denoted by the thick green, magenta, and blue lines, respectively. Credit: Tomer Burg, PolarWx.


