

It's not who I am underneath... But what I do defines me.
- Tweets1.2K
- Following56
- Followers399
- Likes12











ALT A graph plotting the solidification to collection distance ratio (x-axis) versus the solidification to breakup distance ratio (y-axis). The top and bottom halves of the plot are divided into orange-shaded (top) and blue-shaded (bottom) regions, corresponding to liquid drops and liquid jet, respectively. The graph contains data points corresponding to uniform fiber (light blue circles), beaded fiber (brown triangles), or beads (orange squares).


ALT Seven streams of freefalling liquid, shown horizontally. A purple band, representing ultraviolet light, extends across six of the streams. Those streams narrow as they extend from the light, showing their transformation into soft solid filaments.

ALT Diagram of a fast-slow dynamical system's phase space, with the fast variable on the vertical axis and the slow variable on the horizontal axis. A shaded pink region labeled 'Basin of A' contains stable state A near the origin, while an unshaded region labeled 'Basin of C' contains stable state C at high values of both variables. An unstable state B sits at their boundary. A thin pink tongue, labeled 'singular funnel,' extends from B along the bottom of the diagram to arbitrarily large slow-variable values, illustrated alongside a funnel/hourglass icon.

ALT A color gradient contour plot illustrating a singular basin with a singular funnel. On the right, a large region shaded with an orange-yellow color gradient represents the basin of attraction. It contains a thick black vertical curve labeled ɣc (periodic rotation). This region narrows in the lower half, passing a point on the left edge labeled e2 (saddle equilibrium). In the upper half, the region curves around a white space that contains a black point labeled e1 (stable equilibrium). To the left of this region, five very narrow, deep orange vertical strips extend across white space.


ALT Figure with two parts. Part 1 is a drawing featuring six different particle shapes, labeled P1 to P6. P1 is an octahedron, P2 a cube, P3 an icosahedron, P4 and P5 look like archimedean solids; that is, icosahedrons with many more faces; and P6 is a simple sphere. Part 2 is a photograph - the same shapes shown in part 1, also labeled P1 to P6. Now the shapes are made of white plastic, displayed on a table in six rows. Each row is labeled by size - 7.5mm, 10mm, 12.5mm and finally 15mm.

ALT A series of three side-by-side photos capture Kelvin wave turbulence along an air-water vortex filament. A 40-centimeter-long vortex set against a black backdrop is bounded on the bottom by a red tube and on the top by an immersed gray annulus, where the vortex is forced by gentle random horizontal oscillations — generating interacting Kelvin waves that transport energy along the filament.

ALT A photo captures Kelvin wave turbulence along an air-water vortex filament. A 40-centimeter-long vortex set against a black backdrop is disturbed from the top, creating a wavy shape and swirling filaments along which interacting Kelvin waves transport energy.
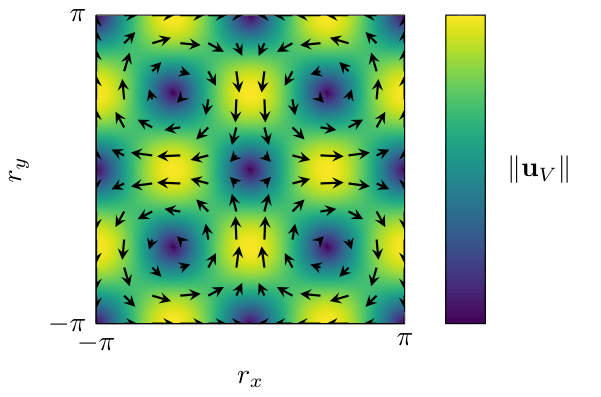
ALT The velocity field magnitude for a 2D vortex looks like a yellow and purple checkerboard with the colors — which represent high and low magnitudes, respectively — fading into each other. Arrows that represent the velocity field encircle the five purple regions, going clockwise in the top left and bottom right and counterclockwise in the top right and bottom left.


ALT Numerical simulation of a quantized vortex line, shown as a wavy red-and-blue filament with helical, corkscrew-like undulations, surrounded by faint gray circular patterns representing sound excitations radiating outward.


