

Exploring the people, ideas, and stories behind physics research.
- Tweets7.5K
- Following513
- Followers76.5K
- Likes2K





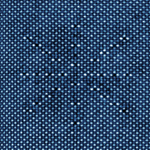

ALT A graph of trapped atoms’ optical depth over 200 milliseconds. Red data points showing atoms loaded using the RPGC-molasses rise and level off near 20 during conventional cooling. When gray-molasses cooling begins at 50 milliseconds, blue points climb steeply and level off near 120. A small inset graph shows the effect peaking near zero when two lasers are tuned for this cooling method.

ALT A grid of yellow squares with the letters JTU written in blue and green. An inset black image on the bottom shows JTU again written in white.

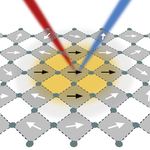
ALT A grid of gray and white diamonds, with the gray diamonds featuring white arrows in the center that point in various directions. In the center of the grid is a red and a blue laser beam that meet and form a V shape. Around these lasers, the squares in the grid are tinted yellow and the arrows in the center of the gray diamond are colored black and all point to the right.

ALT An illustration of red wavy beams of laser light on the left, a green atom surrounded by a single electron in the center, and an analog clock on the right against a yellow background.

ALT An illustration of an open book. The text on the page on the left says “The Born Rule” and lists ingredients in bulletpoints: noncontextuality, normalization, and additivity. The word additivity is circled in red and below is red text that reads no substitutions.

ALT Artist’s illustration of the IceCube Lab sitting atop Antarctic ice at night. A cross section of the ice is visible in the foreground, making the strands of small, black sensors buried in the ice visible. A bright light source shines down from the sky in the top right corner.

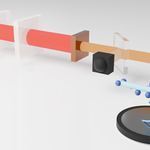
ALT A 3D illustration of an optical setup on a white surface. A red laser beam passes through a lens and two transparent plates, turns orange after a copper-colored block, and continues past a black cube and a glass prism. A curved mirror reflects the orange beam onto a thin, light-blue jet surrounded by small blue spheres representing xenon atoms. A wavy blue line, representing an emitted electron, curves from the jet down to a round black detector.

ALT Illustration of a hybrid quantum computer. On the left, a wavy cyan line representing a boson and a yellow sphere representing a fermion meet at a central point and scatter apart, with arrows marking their path. On the upper right is a large circuit diagram representing the large numbers of qubits and gates. Below it, a much smaller circuit links one thick cyan boson line and one yellow fermion line with a few gates, representing the cavity modes.

ALT A star-shaped atomic pattern inside a chromium sulfur bromide crystal.

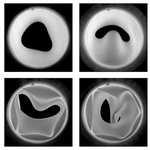
ALT Eight black and white high-speed images showing a soft conical valve oscillating, buckling, folding shut, and turning inside out as fluid pressure increases.

ALT An electron-microscope image of a nanosized cube (red) wrapped in a gold layer against a dark background.

ALT Seven streams of freefalling liquid, shown horizontally. A purple band, representing ultraviolet light, extends across six of the streams. Those streams narrow as they extend from the light, showing their transformation into soft solid filaments.

ALT An illustration of water molecules — represented by red and white spheres — constrained between two parallel surfaces — represented by gray spheres — that are a few nanometers apart. In the center is a row of four white spheres with white arrows between them pointing right, representing charge transport.
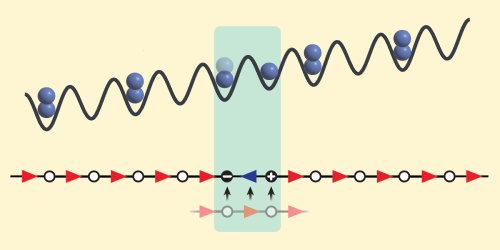
ALT Diagram of a 1D optical lattice with sinusoidal potential energy wells. Blue spheres represent rubidium atoms. They occupy the wells, showing a transition from doubly occupied sites to adjacent single-occupancy sites to mimic false-vacuum decay and particle-pair creation.

ALT Two scientific figures side-by-side. Left: Labeled “Electron gas,” the figure shows charged particles moving along straight paths when no magnetic field is present, and moving along arched trajectories when a magnetic field is applied. Right: Labeled “Molecular gas,” shows neutral particles traveling in straight lines between inter-particle collisions, where an applied magnetic field alters scattering angles and collision probabilities rather than bending individual trajectories.

ALT Artistic illustration of molecules — represented by blue and turquoise atomic spheres — surrounded by translucent light-blue solvents. The background is a gradient of cyan.

ALT Two scientific figures side-by-side show the measured amplitude and phase of out-of-plane displacement fields of water waves. The left panel shows a symmetrical lattice in grayscale, representing the measured absolute wave amplitude. The right panel shows the corresponding wave phase in red, yellow, green, and blue.

ALT Diagram of a fast-slow dynamical system's phase space, with the fast variable on the vertical axis and the slow variable on the horizontal axis. A shaded pink region labeled 'Basin of A' contains stable state A near the origin, while an unshaded region labeled 'Basin of C' contains stable state C at high values of both variables. An unstable state B sits at their boundary. A thin pink tongue, labeled 'singular funnel,' extends from B along the bottom of the diagram to arbitrarily large slow-variable values, illustrated alongside a funnel/hourglass icon.

ALT An illustration with a black background depicts the process of electron-neutrino capture by a gallium atomic nucleus. A horizontal arrow on the left shows an orange particle, an electron neutrino, directed into the nucleus, which is composed of many red and blue spheres representing protons and neutrons and is surrounded by a blurry turquoise halo representing the electron cloud. A bright blue particle to the right is directed outward at an angle, representing an outgoing electron as gallium transforms into germanium.

ALT Scientific illustration of a type-I superconducting YbSb2 crystal exhibiting time reversal symmetry breaking. Purple magnetic field lines approach the crystal from the left and bend around the wireframe unit cell, illustrating magnetic field expulsion due to the Meissner effect. The unit cell contains two Yb atoms coordinated by surrounding Sb atoms. Inside the crystal, a red arrow indicates the presence of a spontaneous magnetic field in the superconducting state probed by muons, while translucent Dirac cone structures represent topological electronic states. The background is pale yellow.