

Designing dbt Charts · Senior Principal Data Graphics Designer & Engineer · Author of Info We Trust · Chartography
San Francisco
Joined September 2013
- Tweets11.1K
- Following391
- Followers10K
- Likes18.1K





RJ Andrews retweeted

This striking 1895 geologic map of the region around Great Smoky Mountains National Park includes six geologic cross-sections to provide rich details of the landscape.
Take a closer look here: loc.gov/item/99446177/?loclr…

ALT Geologic map with six cross-section diagrams of geologic layers and legend information on the left and right sides of the page.
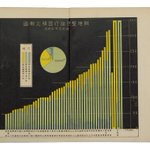
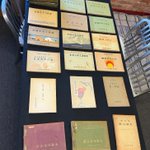
I went looking for one Japanese chart book and ended up with 19 prewar volumes, a new collecting method, and a stronger conviction that graphic history is far from fully known.


RJ Andrews retweeted

Every network chart in Semiotic can now be isometric. I'm in my Zaxxon Phase of my data visualization journey.
semiotic.nteract.io/examples…

Someone gave me $1,000 to build them a data-graphics library and they now have the second-best collection in San Francisco.
My 2025 New York show did not feel special to me as much as it felt natural. The best way to consume data might not be alone on a pocket screen—but together, in conversation, with human-sized artifacts.

“Information graphics is a craft—a coordination of hand, eye, head, and heart—that expands understanding and empowers action.”


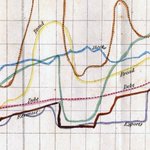
Everything I've learned about charts with two scales (they're not all dueling!): dbtcharts.com/blog/dual-axes…

The defensive distrust we developed toward unknown callers and unsolicited emails has now seeped to images and videos. What content is still trustworthy on the Internet? Shared docs and virtual meetings?


Cartographers don’t say geo-visualization or geo-graphic. They say MAP. I don’t know why we bother with "data visualization" when we can just say CHART.

don't say "data visualizations" chartography.net/p/dont-say-…


Joyful colors that are even brighter in person!
PDF of this atlas here: mbc.cyfrowemazowsze.pl/Conte…


Luigi Perozzo was cooking in 1880: "The word DIAGRAM properly denotes two measurements, coordinated with each other; the word TRIGRAM would be needed to express a three-axis representation ... "

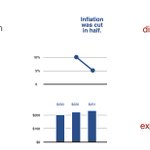
Snuck a short history of floating bar charts into this blogpost. I did not know that McKinsey is responsible for "waterfall" charts before writing this!
dbtcharts.com/blog/you-asked…
