

statistician, data scientist, independent consultant, adjunct asst. prof. @Purdue stats - https://xitter.cf/t.co/D0ML52nqSI
Joined August 2012
- Tweets319
- Following298
- Followers1.3K
- Likes562





Ryan Hafen retweeted

Today in @Nature a synthesis of the epidemiology of child #malnutrition in the Global South published in 3 papers led by our team. Below, I’ll highlight a few of the results #epitwitter #Medtwitter #tweetorial 🧵 (1/17)
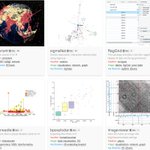
Excited to announce a new #rstats package, Trelliscope, for interactive exploration of data frames of visualizations: trelliscope.org. This reimagines the older trelliscopejs package. It's ready for public evaluation - give it a try and let me know if you have feedback!

Ryan Hafen retweeted

preprint
Child wasting & concurrent stunting in LMIC
@proctorfndn @UCBerkeleySPH @jadebcEpi @UCDavis_IGN @JohnsHopkinsSPH @mark_vdlaan @oleg_sofrygin @Wilson_Tsai @nolan97 @podTockom @nshejazi @hafenstats @ParulChristian @ben83638
medrxiv.org/content/10.1101/…

Ryan Hafen retweeted

This is SUCH a killer chart. Take a look, then take a second look and notice the shape (it ain't alphabetical ordering). Bravo to the authors!
MO also stands out to me. Maybe something .@CoriBush already knows about or for her briefing book
This quoted post is unavailable.
Ryan Hafen retweeted

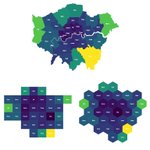
The grid tile map was created using the wonderful tool by @hafenstats which he built for the {geofacet} #rstats 📦
In the end, we simply used #ggplot2's `geom_point()` but it would work as facets as well.
... but imagine a grid of 299 small multiples 🧐
hafen.github.io/grid-designe…

ALT Screenshot of the grid tile builder tool next to a detailed map of all 299 German constituencies.
Ryan Hafen retweeted

Extra waiting time in the US Election = more viz 📈
- A dot density map showing county results and the difference between land and people (big thanks to @benflan)
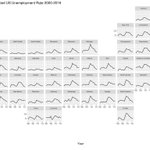
- Results by state as they came in (using @hafenstats great geofacet library in R)
#Elections2020


Ryan Hafen retweeted

Wishing the great trelliscopejs R package by @hafenstats
more wide-spread use! Expanding on #ggplot2 and the also great plotly package by @cpsievert #rstats
youtu.be/f7l9L_CCj40

geofacet 0.2 is now on CRAN. There are now 141 grids. Thanks to everyone who has submitted grids and to @zachstednick for getting them into shape for release.
hafen.github.io/geofacet/
I'll be speaking at the COVID-19 Data Forum sponsored by @RConsortium / @StanfordData tomorrow at 12pm Pacific about work I've been doing with public health / nonprofit orgs related to public data sources and visualization. Open to the public. Come watch! covid19-data-forum.org
Ryan Hafen retweeted

Using code from @topepos, tidy tools from @rstudio, {anytime} from @eddelbuettel, and {trelliscopejs} from @hafenstats, I built a cognostic-guided EDA tool for exploring COVID-19 cases and deaths by state in less than 50 lines of R. #rstats #rmedicine bit.ly/2UMHJbV
Ryan Hafen retweeted

Want to do a faceted graph by region (including US states, but for many other countries as well)? Check out facet_grid() from the geofacet package to order the facets by geography 🤯!
@AlexCEngler #rstatsdc

Ryan Hafen retweeted

The #rstats core team wants our help (Yes, they really do! This was a major topic at #DSC2019).
Here is T. Kalibera laying out ways the R community can contribute to the R project and help insure R's longterm health. developer.r-project.org/Blog…
New blog post: "Introducing rminiconda - Easily Install and Manage Python in R" ryanhafen.com/blog/rminicond…
Ryan Hafen retweeted

Super cool package geofacet by @hafenstats enables you to combine geo mapping with faceting in one plot. #cascadiarconf


Ryan Hafen retweeted

Greenhouse gas emissions in the EU, 1990-2016. Remarkable differences between east and west.
First try with the great #Rstats geofacet package by @hafenstats hafen.github.io/geofacet/

Ryan Hafen retweeted

flock of #rstats devotees! tonight we mount the steed of geofacet and ride towards the clouds made possible by Google trends. It's rent vs. buy. fearless riders @philmassicotte and @hafenstats made it mostly possible. verbumdata.netlify.com/2019/…

Ryan Hafen retweeted
Our book "A Computational Approach to Statistical Learning" is out and it includes reference implementations in R for all model-fitting algorithms presented. The R package is on the way. @statsmaths bit.ly/2RJiIL5 #rstats