

Table generation packages for R and Python. Helping you make beautiful tables since 2018. Join our wonderful Discord at https://xitter.cf/t.co/QImzxY4SM8
GitHub
Joined August 2022
- Tweets178
- Following2.7K
- Followers3K
- Likes122


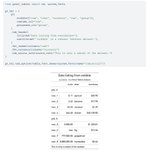
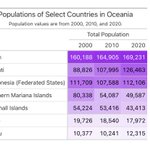



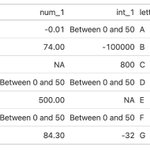
Great Tables v1.1.0 is out, three weeks after v1.0.0. The two releases add fraction and chemical formula formatters, value-based styling, multi-column stubs, decimal alignment, diverging and row-wise data_color(), and so much more. There's a post on this:
opensource.posit.co/blog/202…

Great Tables v0.22.0 is out! It's a really big release for this Python table library. You get: footnotes, per-group summary rows, and column merging, text transforms, new formatters, better image export via `gtsave()`, better LaTeX output. Blog post at: opensource.posit.co/blog/202…

gt 1.2.0 is now out (on CRAN)!
Major highlights include:
- SI prefix formatting w/ `fmt_number_si()`
- multi-column stubs for hierarchical row labels
- new `summary_columns()` function
- major improvements to LaTeX, Word, and RTF rendering!
github.com/rstudio/gt/releas…

The {gt}/great_tables Packages retweeted

The gtsummary package in R makes it easy to create clean, publication-ready summary tables for your data. The tbl_summary() function takes a data set and generates well-organized tables that display key statistics like counts, percentages, means, and medians, which is perfect for presenting descriptive statistics in reports, manuscripts, or presentations.
✔️ Streamlines Descriptive Statistics: Quickly generates clear and professional summary tables.
✔️ Customizable: Offers flexible options for labels, decimal places, and formatting.
✔️ Supports Various Data Types: Works with continuous, categorical, and dichotomous variables seamlessly.
The visualization below shows a sample table created with tbl_summary(), illustrating its ability to organize and present descriptive statistics effectively. Visualization adapted from the official package website: danieldsjoberg.com/gtsummary…
Want to explore more practical tips on Statistics, Data Science, R, and Python? Subscribe to my email newsletter! More information: eepurl.com/gH6myT
#Rpackage #RStats #DataScientist #pythoncode #DataScience #database #Python

Showcase your table-creation skills in the Posit Table contest! All skill levels welcome. Submit your table by October 3, 2025 for a chance to win great prizes!
Blog post: posit.co/blog/announcing-the….
Info on submitting:
github.com/rich-iannone/tabl…
Can’t wait to see what you create!

The {gt}/great_tables Packages retweeted

Pues ya es viernes. Los suscriptores premium sabrán como extraer estos datos de la página de
@Proballers_com y hacer esta tabla con #Python 🐍 y en R @gt_package (great_tables). También puedes apoyar el proyecto o leer una pequeña parte free
Aquí 👉 shorturl.at/Pi3oE

Just released `v0.18.0` of Great Tables to PyPI! Lots of fixes in this release along with new methods like `tab_spanner_delim()`, `cols_label_rotate()`, and `fmt_tf()`.
Check out the release notes at: github.com/posit-dev/great-t….

The {gt}/great_tables Packages retweeted

I discovered @gt_package via Talk Python to Me.
Unlike pandas or Polars, which are for computation, gt is for restitution tables. You start with a DataFrame, then style and build your final table.
My small example: top 10 countries at the last Olympics... 🤸♀️

The {gt}/great_tables Packages retweeted

github.com/ninoseki/arakawa
v0.0.14 is out (Polars and @gt_package integrations have been added)

Hey! We've released Great Tables `v0.16.0` and it's got a cool new feature for applying conditional styling to rows on a per-column basis! The new `mask=` arg in `loc.body()` gives you that freedom to style a table based on a Polars DF. Blog post at:
posit-dev.github.io/great-ta…
The {gt}/great_tables Packages retweeted

#maps a table of geographic data file formats - raster and vector - for #geocomputation in #rstats
Full code & examples: tinyurl.com/geo-file-formats
Created with @gt_package by @posit_pbc

ALT Different kinds of File Formats dealing with Geo-Spatial Data
We did *so much* with table packages (both in R and Python) in 2024. So much so that I put together a little round up post for the Posit blog.
posit.co/blog/what-we-did-wi…
The post gathers up the things we did for our display-table packages (gt & Great Tables), and a whole lot more!

New version (v0.15.0) of Great Tables is out! Features: (1) add flag icons with fmt_flag() method, (2) add Font Awesome icons w/ fmt_icon(), and (3) use accounting notation.
There's a new blog post that goes over some of the improvements to Great Tables
posit-dev.github.io/great-ta…
The {gt}/great_tables Packages retweeted

Free @gt_package workshop with the package maintainers @riannone & @chowthedog ! Hands-on session about making #python tables!
Friday Oct 25, 2024 3:00 - 05:00 PM ET
events.zoom.us/ev/AvobJEOTVw…
Credentials via #Credly!
#OpenSource #datascience #rstats

ALT https://events.zoom.us/ev/AvobJEOTVwkUnH6_TgLZDZJauk4dxfm5jCG8JFNN9zukOcsVLvTN~AmO5XY5HRBcxkKG6Hga1aXZaYtpBSER6jHms1seP-NNOA0dhcQZUGJ2NWg
The {gt}/great_tables Packages retweeted

Quick update:
@nixtlainc added conformal prediction intervals to {neuralforecast} two days ago 🔥
Now conformal intervals can be added to KAN or other engines.
I limited to 20 epochs, added some spec, fit, predict wrappers, & messing with {patchwork} 1.3 for ggplot2 + gt

ALT Conformal KAN patchwork dashboard


Great Tables 0.13.0 is out! Now you can fully, and precisely, style your table with `tab_style()` with the enhanced location (`loc`) targeting options.
Check out the blog post at
posit-dev.github.io/great-ta…
explanations and examples!


Great Tables 0.12.0 is now on PyPI. Some new features:
- integration of fonts from Google Fonts in your table (w/ google_font())
- row striping is now possible through either tab_options() or opt_row_striping()
Check out the blog post at
posit-dev.github.io/great-ta…
for examples!
The {gt}/great_tables Packages retweeted

Tomorrow 👀
Table themes, utility functions, and more -- gtUtils

The {gt}/great_tables Packages retweeted

Tables are about to get a whole lotta love in patchwork #rstats

The {gt}/great_tables Packages retweeted

Latest @LeaguesCup 2024 Projections 📊⚽️
- Columbus Crew is the favorite with a 26% shot at glory! 🏆
- Toluca and UNAM Pumas are leading Liga MX with strong chances to advance deep. 🇲🇽
- Mazatlán FC has slim chances, but never say never in football!
#LeaguesCup2024
