

The Data Analysis and Visualization Group (DBVIS) of Daniel A. Keim at the @UniKonstanz
University of Konstanz
Joined August 2009
- Tweets412
- Following135
- Followers4.6K
- Likes524





Pinned Tweet
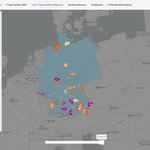
Neues coronavis.dbvis.de Feature 🎉
>Konfigurierbare Dashboards<
Damit kannst du ganz einfach Dashboards mit vielen Charts erstellen um Informationen und Regionen zu vergleichen. Die Charts können gespeichert und per URL geteilt werden.
Entwickelt an der @UniKonstanz
Data Analysis and Visualization retweeted

Want to explore #wordembedding properties? Here are some ideas for data preparation steps✂️, interesting additional features🍩, and some relevant references✍️: embedding-framework.lingvis.… With
@melassady 😊 #nlviz #ieeevis #LLMs
Data Analysis and Visualization retweeted
Our visualizations show that larger models, e.g., ChatGPT and Bard, are less biased than their smaller counterparts. Are the models getting better or the engineering steps used to adapt the outputs? 🤔@melassady #ieeevis #vds 👉prompt-comparison.lingvis.io


Very interesting work: Visual Comparison of Text Sequences Generated by Large Language Models
R. Sevastjanova, S. Vogelbacher, A. Spitz, D. A. Keim, M. El-Assady
#VDS Symposium @ieeevis
Demo and paper 👉🏼prompt-comparison.lingvis.io…
Data Analysis and Visualization retweeted
What biases are encoded in texts generated by #LLMs? Our workspace helps to explore stereotypes encoded in prompt outputs and detect unexpected word associations. @melassady will present our work
@VisualDataSci🥳 Paper and demo: prompt-comparison.lingvis.io #ieeevis2023 @ieeevis

Data Analysis and Visualization retweeted

Deadline extension! Workshop submissions are now due July 8th!
Find more information here: vis4pandemres.github.io/cfp/
Looking forward to your contributions!
Data Analysis and Visualization retweeted

Last paper session at #EuroVis this morning is on visualization and machine learning.
@metz_yannick will be presenting our work on interactive state sequence exploration for #Reinforcement_Learning (diglib.eg.org/handle/10.1111…)
#eurovis2023 #ieeevis #visualization #visxai


Data Analysis and Visualization retweeted
Our templates for video bulletin submissions are now online (vis4pandemres.github.io/cfp/). We also thank the preliminary AP & IPC for their support (see vis4pandemres.github.io/orga…).
Submissions are due July 1st! @ieeevis #ieeevis
Data Analysis and Visualization retweeted
Thank you to #EuroVis and the Early Career Award Committee for the award. I'm honored and humbled to be working in, and recognized by the amazing #ieeevis community. Looking forward to many more years of #visualization research and future collaborations. ☺️
#eurovis2023


Data Analysis and Visualization retweeted

Daniel Keim and Menna El-Assady of Univ of Konstanz offer an interactive exploration tool for a thoughtfully indexed set of 71 papers on Human-Centered Evaluations of Human-Centered Machine Learning human-centered-evaluations-s…
Data Analysis and Visualization retweeted

Nach dem erfolgreichen Kick-Off im April '22 wurde das #UniKonstanz Centre for HUMAN | DATA | SOCIETY gegründet. Das Zentrum untersucht transdisziplinär Aspekte der Datengesellschaft sowie die Interaktionen zwischen Menschen + datengetriebenen Systemen. t1p.de/4lrpm

Data Analysis and Visualization retweeted
How should we compare the embedding spaces of large language models? Did language model adapters (@AdapterHub) introduce bias? Join us in the current #ieeevis session on comparison in Oklahoma Station 1. #vis22

Our @ieeevis paper shows how to visually compare embedding spaces produced by adapted language models. Thanks, @AdapterHub, for the variety of adapters for evaluation!🥳And a big thank you to my co-authors E.Cakmak @ravfogel @ryandcotterell @melassady!😀 adapters.demo.lingvis.io/


Data Analysis and Visualization retweeted
Our @ieeevis paper shows how to visually compare embedding spaces produced by adapted language models. Thanks, @AdapterHub, for the variety of adapters for evaluation!🥳And a big thank you to my co-authors E.Cakmak @ravfogel @ryandcotterell @melassady!😀 adapters.demo.lingvis.io/
Data Analysis and Visualization retweeted

Today, I'm happy to present "Semantic Color Mapping: A Pipeline for Assigning Meaningful Colors to Text" at the @VisGuides workshop at IEEE VIS2022 #VIS22 @ieeevis. This is joint work with @melassady @RSevastjanova @spinthil, Rebecca Kehlbeck, Udo Schlegel and @FSperrle @dbvis

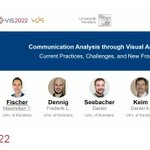
Happening now at #IEEEVIS 2022:
Max Fischer presenting live our research on communication analysis with @ETH_AI_Center.
@frederikdennig, @seebacherd, D. Keim @dbvis, and @melassady
@ieeevis #VDS
Drop by or visit the conference website to check it out! communication-analysis.dbvis…

Data Analysis and Visualization retweeted

We are presenting our work on #VisualMusicology at the AI+X Summit 2022 with @ETH_AI_Center today! Drop by our booth R2 and check it out!

Data Analysis and Visualization retweeted
We prepared all our research material as a Linktree to provide a concise overview of all our recent projects.
🚀🚀🚀Enjoy🚀🚀🚀
linktr.ee/visualmusicology

Data Analysis and Visualization retweeted
To "understand language", masked #languagemodels should capture semantic constraints of function words (e.g., negation, coordination, quantifiers). We show that BERT, RoBERTa, and ALBERT don't: arxiv.org/abs/2209.07836 More: function-words.lingvis.io
To appear @coling2022 . @dbvis


Negation, Coordination, and Quantifiers in Contextualized Language Models arxiv.org/abs/2209.07836
Data Analysis and Visualization retweeted
What a cool summary of our recent paper on challenges that may occur when designing language model explanations! 😍 Thanks, @NLPParrot ! 😀 Paper: arxiv.org/abs/2207.06897 @manunna_91 @dbvis


As I mentioned before, I am really glad to be able to merge my love for NLP with that of sketchnoting for science communication.
Today's paper is "Beware the Rationalization Trap!" by @RSevastjanova and @manunna_91
(1/7)


Data Analysis and Visualization retweeted
Do you know about the Rationalization Trap in #XAI? We present a conceptual model on challenges that can occur when language model explanations differ from our mental model of language.✍️@manunna_91📢@IJCAIconf #IJCAI2022Workshop
Read more about it here: arxiv.org/abs/2207.06897

Data Analysis and Visualization retweeted
Happening now at #eurovis2022, @ibltzr presenting our typography of guidance tasks in mixed-initiative visual analytics, a collaboration with @dadolissimo @SilviaMiksch13 and @FSperrle. #eurovis


This Post is from an account that no longer exists. Learn more
Data Analysis and Visualization retweeted
Happening now at #eurovis2022, @RSevastjanova presenting our work on Language Model Explainability (@LingVISio). Check out lmfingerprints.lingvis.io/ for more information. #NLProc

We use visual analytics to create insights into properties learned by transformer-based language models. Our scoring functions can be used as an interpretable alternative to probing classifiers😉 Check out: lmfingerprints.lingvis.io @manunna_91 @HannaJSchaefer @dbvis @EuroVisConf
