Danail Bonev retweeted

A must watch video from Scott O'Neil about general market and trading
Bookmark


Danail Bonev retweeted

Market Breadth: Percentage of Technically Healthy Stocks (SATA 6+) per Sub-industry Group

Danail Bonev retweeted

A trader from Hong Kong made 969.8% in one year and won the 2025 U.S. Investing Championship.
His go-to setup risks just 0.5% of his account per trade.
Small mistakes. Big winners.
Here's the 4-step playbook ↓

Danail Bonev retweeted

BREAKING:
Inspired by France, young second and third-generation migrants started looting stores in Milan, Italy around 2 hours ago.
International mainstream media isn’t showing just how bad things are in Europe.
Danail Bonev retweeted

France. A rich country with excellent human and entrepreneural capital, destroyed by mass migration, statism and socialist big government. A warning to the world.
When you listen to fools, the mob rules.

Danail Bonev retweeted

My trading got better when I understood how to find & trade momentum stocks 👇
youtu.be/1kSbpd7EEi0

Danail Bonev retweeted
Stage Analysis Screener – Stage 2 Breakouts & Continuation Breakouts
HLT, CME, MAR, COR, CTSH, KMI, RSG, AIG, CNQ, DG, CHD, HAS, OLLI, RRC, COKE, ASO, BTE, RELX, TS, MUR, WMG, NOG, EDU
Filters:
Stage: 2A, 2, 2B
Stage Change: Stage Changed
Market Cap: +Mini (over $300mln)
WCR: Close in Upper Quarter of Bar
Avg $ Volume: Over 100M
Breakout: 13W Breakout – Cross Above 13W High
Sort order: Average Dollar Volume
The purpose of this scan is to find stocks attempting to breakout into Stage 2 and continuation breakouts already in Stage 2



Danail Bonev retweeted

Something VERY interesting happened in the stock market today...
For the first time in a while, we're starting to see CAPITULATION-STYLE VOLUME OFF THE LOWS in a lot of stocks
And I don't think enough people understand why this is so important
For the past few months, trading volume has been incredibly low
A lot of fund managers and institutions have seemingly been sitting on the sidelines, waiting for better opportunities to deploy capital
When institutional participation is lacking, stocks have a much harder time sustaining moves. Breakouts fail, rallies get sold, and momentum becomes increasingly difficult to find
BUT
Today we finally started seeing something different...
Stocks that had been selling off for several consecutive sessions began attracting significant volume near their lows
And more importantly, PRICE WAS GETTING BOUGHT UP
This is what we refer to as CAPITULATION VOLUME
Here's why it matters:
When a stock has been declining for several days, fear starts building.
-Longs begin panic-selling
-Weak hands capitulate
-Late shorts chase the breakdown
-Price becomes overextended below its moving averages
-Selling volume accelerates
Eventually, you can reach a point where an enormous amount of selling occurs in a very short period
But here's the important part...
What happens when all that selling volume comes in, yet price STOPS going lower?
That's where things get interesting
If a stock trades on unusually high volume near its lows but begins recovering and closes near the highs of its candle, it can indicate that buyers are absorbing the selling pressure
Think about the psychology...
Everyone wants out, yet somebody is willing to take the other side of those transactions
And when enough demand steps in, the selling pressure can become exhausted, leading to a very aggressive reversal
This is one of the most important concepts in Volume Price Analysis (VPA).
But how can we actually take advantage of this?
Here's what I look for:
1. CAPITULATION VOLUME
A sharp decline after several consecutive red days, followed by unusually high volume near the lows
2. A CHANGE IN PRICE ACTION
I want to see the stock stop making new lows, form a hammer or bullish engulfing candle, and begin closing near its highs
3. THE RIGHT SIDE OF THE V
I'm NOT trying to predict the bottom.
I want to see price reclaim important levels, establish higher lows, and begin breaking its sequence of lower highs
4. VOLUME CONFIRMATION
Ideally, volume expands on the recovery and contracts during pullbacks
This can indicate that buying interest is returning while selling pressure is weakening
5. FOLLOW-THROUGH
One strong reversal candle isn't enough to confirm a lasting bottom
I want to see whether buyers continue defending the lows over the following sessions, with price eventually reclaiming important moving averages and building constructive bases
Now here's the MOST important takeaway...
Today's volume does NOT necessarily mean the market has bottomed
Capitulation can happen multiple times throughout a correction, and a large volume candle by itself doesn't prove institutional accumulation
However, after months of relatively weak participation, seeing this type of volume return near the lows is something worth paying very close attention to
It could be an early indication that fund managers and institutions are beginning to find attractive opportunities in quality companies at these lower prices
And if this buying interest continues, it may eventually lead to stronger accumulation patterns and a healthier market environment
Remember:
A bottom isn't confirmed by one big green candle
Bottoming is a PROCESS:
First comes capitulation
Then the reversal
Then accumulation and improving price structure
&
Eventually, if demand continues to build, a new uptrend can develop
Today was the first encouraging sign of meaningful buying interest near the lows that I've seen in a while
Now the question is whether that demand can sustain itself over the coming sessions
That's what I'll be paying attention to


Danail Bonev retweeted

If you own one gold coin, you hold more gold than 72% of the world's family offices. Their most cited risk is geopolitics.
Yet gold ETFs drew a record USD 31bn in Q3, led by Europe and North America, and kept buying as the price fell in September.
The chapter on why is below.

Danail Bonev retweeted
AFTER 6 YEARS OF FULL-TIME SWING TRADING,
THESE ARE THE ONLY 3 SETUPS I’D EVER GIVE YOU 👇


Danail Bonev retweeted

Bear Call Spread Ideas for $TSLA Earnings Next Week
barchart.com/share/news/6676…

Danail Bonev retweeted
An iron condor from 45 DTE to expiry 👇
Time decay pays you, but it makes you wait.
Once you get closer to expiry, time decay starts to pick up.
Danail Bonev retweeted

ANTHROPIC JUST DROPPED THE BEST 1-HOUR AI AGENT CRASH COURSE THAT YOU’LL FIND
It covers:
- building /skills, /loops, and graphs
- agent dreaming & orchestration
- reverse engineering with Claude agents
Danail Bonev retweeted
If you already trade credit spreads or cash-secured puts, you're closer to mastering iron condors than you think.
An iron condor is simply two credit spreads placed simultaneously, one on each side of the market, designed to profit when a stock stays within a defined range.
In this video, you'll get the complete framework: structure, setup, underlying selection, and the exact management rules I follow on every single condor trade.
Watch the Video 👇
youtube.com/watch?v=qmy5P4TR…

Danail Bonev retweeted

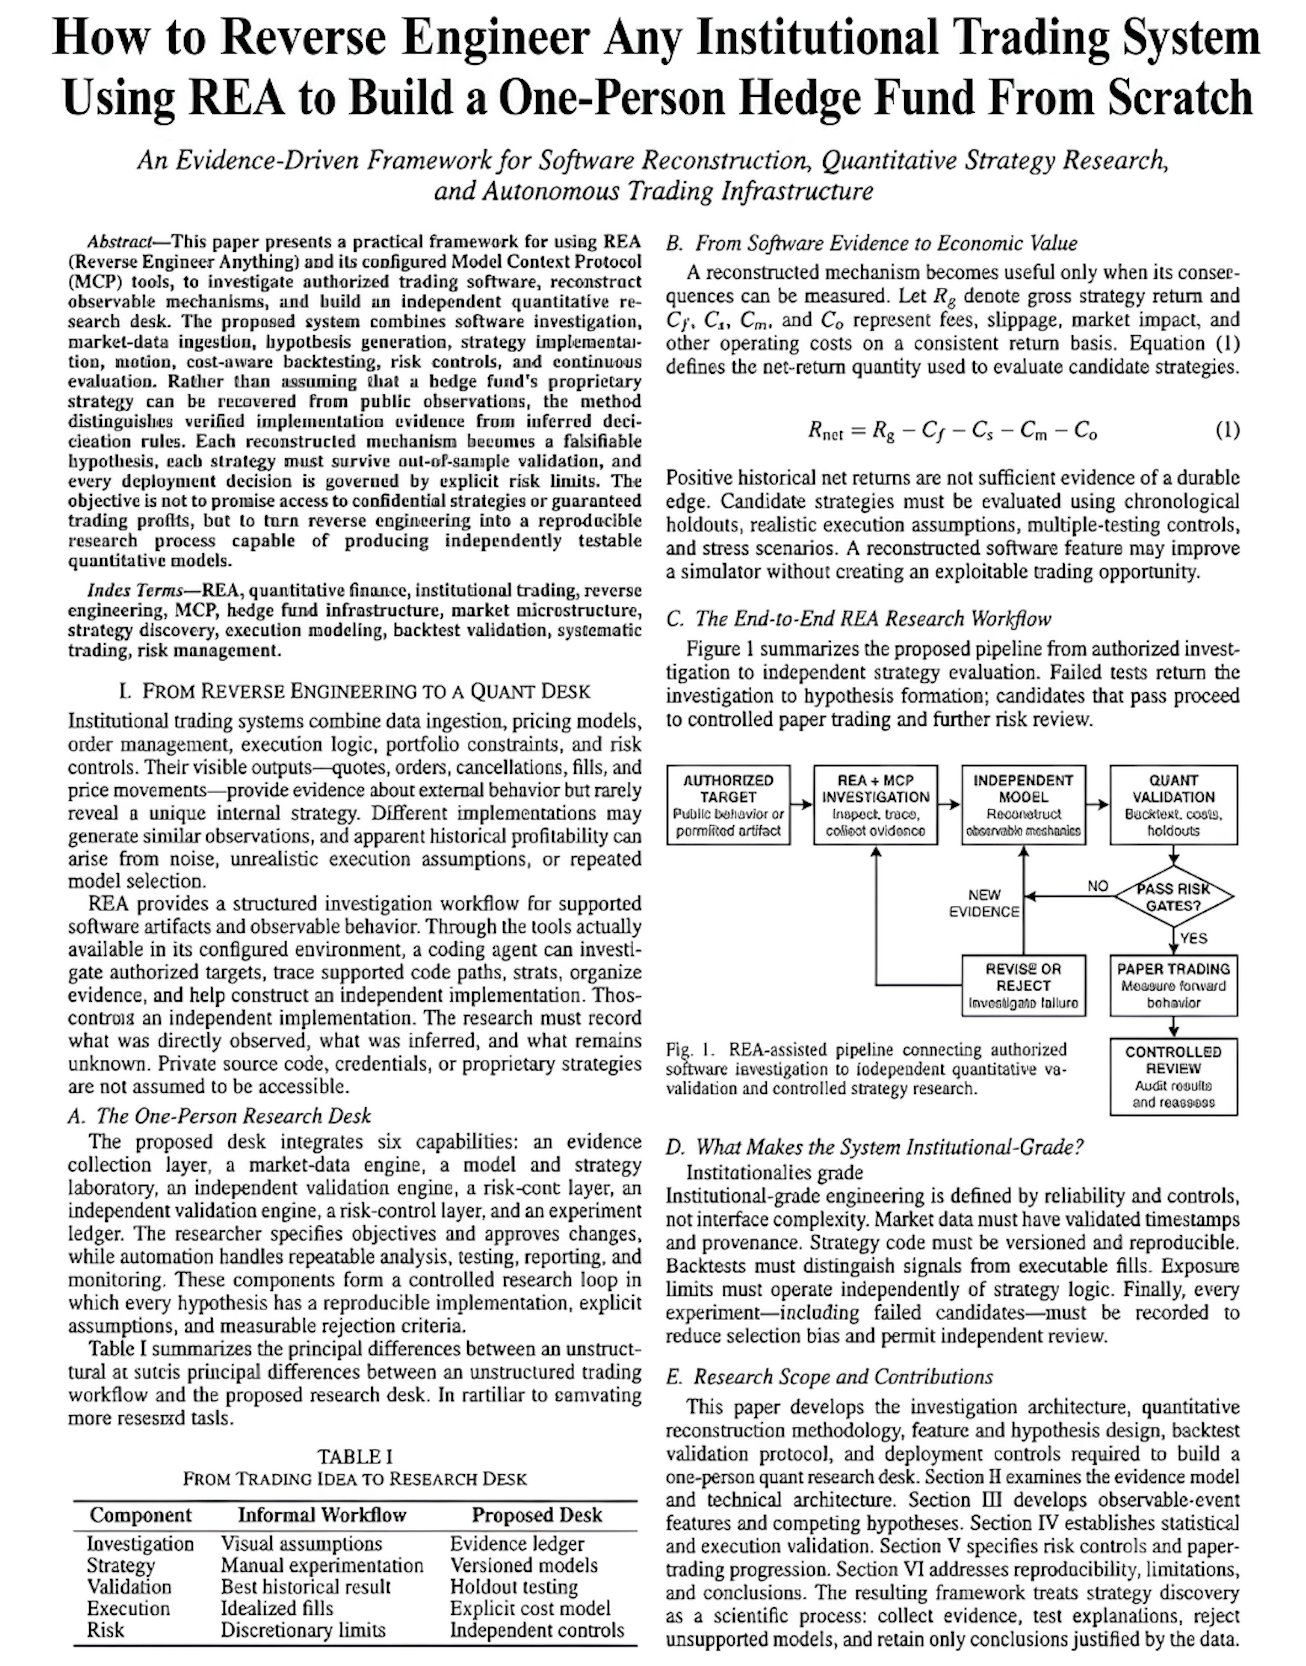
REA (Reverse Engineer Anything) is the MOST dangerous MCP for traders
i am literally SHOCKED...
REA (Reverse Engineer Anything) could crack apart any trading system from scratch & inspect its source code along with its binaries for completely FREE
i wrote a 6-page research paper on using REA + Opus 5.5 to reverse-engineer trading mechanics & build your own trading agents in RUST
here is how you do it:
1. the REA workflow investigates application behavior, traces code paths, maps dependencies and reconstructs how trading systems operate
2. the source-code and binary analysis layer examines functions, recovers program structure, and traces implementation details in authorized targets
3. the behavioral analysis engine studies order submissions, cancellations, market-data updates and execution events to infer trading mechanics
4. the Opus 5.5 research agent turns findings into Python models, trading bots and testable strategy hypotheses
5. the backtesting engine evaluates strategies against historical data, fees, slippage, out-of-sample periods, and predefined validation criteria
6. the autonomous research loop logs experiments, investigates failures, monitors performance, and refines strategies under explicit risk limits
the full research framework is in my article below: