

Stage Analysis Screener & Market Breadth Tools Stock Trading & Investing – Stan Weinstein's Stage Analysis & Wyckoff ➜ Join: https://xitter.cf/t.co/mtOKZZIXec
Joined February 2013
- Tweets22.8K
- Following769
- Followers41.8K
- Likes7.7K




Pinned Tweet
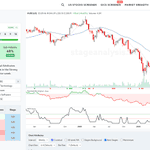
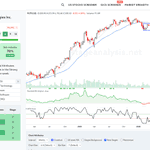
Stage Analysis – The Four Stages
******************************
Thread:
Examples of each of the Four Stages to help you learn Stan Weinstein's Stage Analysis method.
Also will help you understand what I'm referring to in my posts
#stanweinstein #stageanalysis #stocks #study

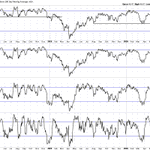
Market Breadth: S&P Composite 1500 Moving Average Breadth
▪️46.93% > 200 day MA (Long-term)
▪️45.00% > 150 day MA (Medium-term)
▪️34.80% > 50 day MA (Short-term)
▪️52.20% > 20 day MA (Very Short-term)
Combined Average: 44.73% (Neutral)


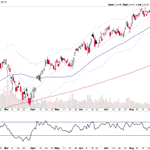
$RSP S&P 500 Equal Weight - looking for a close above the 50 day MA for more confidence again. Neutral position currently between its 21 day EMA and +1x ATR level

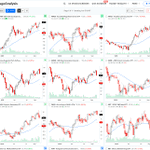
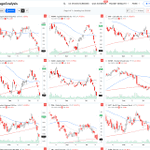
A number of the leading ETF themes with a change of behaviour (significant negative bars) last week, as tech sold off. Quick reversals are needed or they could turn in a change of character and trend changes.


Weekend Video Part 1: Major US Indexes $SPY, $QQQ, $IWM, $VIX (10mins)
▪️Login for full length video (57mins) discussing all the data for the Stage Analysis method (made famous in Stan Weinstein's classic book)
stageanalysis.net/blog/14175…

New Blog Post: Earnings Watchlist
There are 18 stocks highlighted from the weekends US stocks watchlist scans – $NFLX, $META, $ISRG
stageanalysis.net/blog/14171…

Stage Analysis Screener – New Stage 4 Breakdown Attempts
STX, AMAT, CAT, KLAC, AAOI, SCHW, FIX, DAL, HUT, STM, JBL, FLEX, DOCN, AEHR, JAZZ, LSCC, AUR, BNTX, FCEL, VSAT, VSH, CGNX, INFQ, OUST, ACMR, GTX, ERAS, NUAI, BHVN, BELFB, BLTE, AMBQ, BLZE, PVLA, PHVS, IDYA, SKYW, PDFS, RXT, GRPN, IFNNY, DCH, FSK
Filters:
Stage: 4A
Stage Change: Stage Changed
Market Cap: +Mini (over $300mln)
WCR: Close in Lower Quarter of Bar
Avg $ Volume: Over 100M
Breakout: 13W Breakdown – Cross Below 13W Low
Sort order: Average Dollar Volume
The purpose of this scan is to find stocks attempting to breakdown into Stage 4

Stage Analysis Screener – Stage 2 Breakouts & Continuation Breakouts
HLT, CME, MAR, COR, CTSH, KMI, RSG, AIG, CNQ, DG, CHD, HAS, OLLI, RRC, COKE, ASO, BTE, RELX, TS, MUR, WMG, NOG, EDU
Filters:
Stage: 2A, 2, 2B
Stage Change: Stage Changed
Market Cap: +Mini (over $300mln)
WCR: Close in Upper Quarter of Bar
Avg $ Volume: Over 100M
Breakout: 13W Breakout – Cross Above 13W High
Sort order: Average Dollar Volume
The purpose of this scan is to find stocks attempting to breakout into Stage 2 and continuation breakouts already in Stage 2

Scan for stocks that meet the Stage Analysis criteria on stageanalysis.net – a dedicated platform for the Stage Analysis method with unique tools and features that will save you time in your daily/weekly research.

Semiconductors & Semiconductor Equipment industry group has moved into potential Stage 3,
A few of the biggest stocks in the group are still in late Stage 2, but the majority of individual stocks are in Stage 3 and early Stage 4 currently.
Largest 20 Semiconductor stocks by Dollar Volume:
MU, NVDA, AMD, INTC, AVGO, MRVL, TSM, SKHY, AMAT, LRCX, ASML, QCOM, KLAC, CRDO, TXN, CBRS, ARM, ADI, ALAB, TER

New Blog Post: Market Breadth: Percentage of Stocks Above their 50 Day, 150 Day & 200 Day Moving Averages Combined
▪️32.89% (-1.61% 1wk)
Status: Difficult Environment
stageanalysis.net/blog/14168…

My data provider is having an issue with their intraday data where the High and Low values are not updating intraday, but the Close and Volume data is updating properly. So I'm talking with their support to try and get them to fix it urgently. Hopefully, will be back to normal in the next few hours.
$HUBS developing a Stage 1 base over the last 6 months or so. Currently testing its 200 day MA in late Stage 1, with improving relative strength and technical attributes. Approaching its Stage 2 breakout level

$PLTR rebounding from the short-term 21 day EMA yesterday and the September pivot high.
Still early in the current Stage 2 advance. The previous Stage 2 advance from May 2023 ran over 2,000% before topping out. The current Stage 2 advance is 28.08% so far 👀

Market Breadth: S&P Composite 1500 Moving Average Breadth
▪️48.73% > 200 day MA (Long-term)
▪️46.13% > 150 day MA (Medium-term)
▪️35.67% > 50 day MA (Short-term)
▪️57.53% > 20 day MA (Very Short-term)
Combined Average: 47.02% (Neutral)
Of note is the strong improvement in the very short-term metrics from the lower zone back to above 50%
