

Crypto market notes. On-chain view.
worldwide
Joined February 2022
- Tweets106
- Following421
- Followers25
- Likes50





ryn0chek retweeted

⚡ It’s official: tokenized uranium is available to trade now! Powered by @Tezos, @ArchaxEx, and Curzon, you have the opportunity to invest in physical uranium–U308—via our trading platform.
Buy, own, and trade physical uranium:
🔸 A direct and transparent way to invest in uranium
🔸 24/7 global trading
🔸 Get started with any amount—no minimum purchase required
⚡ Learn how you can buy and trade physical uranium now: uranium.io/.
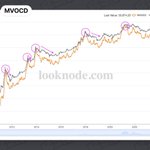
Median Value of Coin Days Destroyed (MVOCD).
When the MVOCD value approaches the price of an asset, it indicates that large volumes of coins that have been accumulating for a long time before are being moved. large holders are selling as they are expecting a decline.

29
ryn0chek retweeted

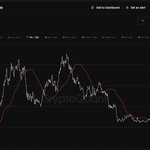
Nope, this isn't RSI on #Bitcoin, this is MVRV-Z, viewed on a Monthly time frame.
Doing it this way gives it incredible accuracy compared to its normal counterpart.
What can we learn from this?
1. The bottom is in with a precise touch of the ascending trend line.
2. A retest of the lows is incredibly unlikely with MVRV being out of the bottom range, and near the support zone of the 2020 black swan.
When you see metrics like this, you just have to think... why are you worried about current prices?
Good things come to those who wait.

ryn0chek retweeted

ELR, the ratio of Open Interest to Exchange Reserves, has been rising since April 27, peaking on June 2. Recently, it's rising again, suggesting traders are increasingly using high leverage.


RP and SSR are showing reactions on 100D EMA. That is good sign. That means that is bullish trend is not ended yet.

28
MVRV Ratio (Market Value/Realized Value) is on it's support line. It is important not to cross it. Anyway we will see market activity very soon i guess.

1
30


ryn0chek retweeted

1/7:
📊🔬Another explainer thread? Let’s do it! The MVRV Z-Score chart by Look Into Bitcoin. This unique tool offers valuable insights into market cycles and helps us gauge the relative value of #Bitcoin. Check it out here:
lookintobitcoin.com/charts/m…
#CryptoAnalysis #Investing
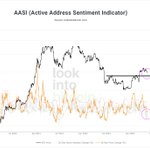
Short-term metrics:
1. AASI – comparison of active addresses change (for 4 weeks) & BTC price change (for 4 weeks).
2. Advanced NVT Signal – 90DMA of Daily Transaction Value with deviation bands.
Both of them has more descending potential then ascending in short-term.


55
ryn0chek retweeted
🧵1/7
Two days ago, #BTC's Open Interest (OI) showed a curious situation. OI was falling, while the BTC price was rising.
Essentially, this is a divergence and it can suggest several things:


