

"Let the Chart Speak" #Crypto #Commodity #Equity All my tweets for education & research purpose only Not a Finical Advice
Global
Joined August 2010
- Tweets3.1K
- Following21
- Followers1.7K
- Likes3.1K


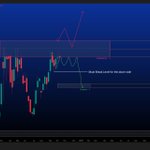

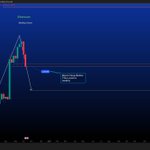


Chart Seekers retweeted
$CRCL
Market Structure & Wave Pattern: The chart outlines an ABC corrective/impulsive pattern. Wave (A) completed a previous bounce and reach around $136 - $139, while Wave (B) is forming near the lower key support area.
Decision Area & Key Support: Price is currently hovering around a Decision Area / Support-1 region near $68.00 to $60.00.
Bullish Scenario: If price holds above the primary support zone and breaks key overhead resistance, it sets up a long-term Wave (C) rally targeting $174.00+.
Bearish / Downside Risk: A breakdown below the red horizontal key level ("Must Break This for the downside") invalidates the immediate bullish structure and retest the support -1 even this would trigger a drop toward lower highlighted in orange ("Pending To Hit if the support Break") around the $40.00–$35.00 zone.
This is a technical analysis NFA and DYOR

Chart Seekers retweeted
$ar
One more X Please


$AR
Nothing has changed since my post back in Nov-2025 and posting it again today.
This is another perfect example that those who survive the ‘B’ wave with patience and conviction are the ones who get rewarded in the ‘C’ wave.
Market noise shakes weak hands, but structure always speaks in the end.

Chart Seekers retweeted
$BTC 📊 LONG-TERM TECHNICAL ANALYSIS
Forget the daily noise. Forget the FUD, FOMO & emotions.
Zoom out. Read the structure. Follow the trend. 📈
Markets move in cycles, and patience is part of the game.
This video breaks down the long-term chart structure, key levels & possible roadmap.
🎯 Let the Chart Speak.
DYOR | Technical Analysis Only | Not Financial Advice
Chart Seekers retweeted
vechain:native has started knocking on resistance door. 🐕🚪
After being called a “shitcoin” throughout the bear market.
VET said:
“Keep that same energy. I’ll vet the shit out of your shorts.” 😂📈
Resistance: 0.0349 → 0.0591 VET: “Excuse me, I have some old haters to visit.” 😭💀
From “shitcoin” to “shit, it’s pumping.” 🚀🔥

🚨 $VET HOLDERS, WAKE UP! 😂
VET has been sleeping so long even the EMA stopped checking on it. 💤
But now the chart is like:
“Guys… I might finally go outside.” 🚀😂
🎯 Resistance: $0.0344
🔥 Next zone: $0.0591
👀 Bull case: $0.14+
Will VET finally break out of the crypto retirement home, or is it going back to sleep? 😂
What’s your target? 👇

Chart Seekers retweeted
creditcoin-2:native after surviving the bear market:
Bear Market: “I’m finished.” 🐻
Creditcoin: “Bro… I was just charging.” 😂🔋
Now, if the bear run is finally coming to an end, some sleeping alts are slowly waking up… 👀
And Creditcoin looks READY TO TEST THE RESISTANCE AGAIN. 📈🔥

Chart Seekers retweeted
$BTC
#Bitcoin has confirmed a strong monthly close, finishing above the previous month’s candle — a bullish signal that strengthens the ongoing macro uptrend. This monthly breakout keeps the higher-timeframe structure intact and increases the probability of continuation toward the major supply zones ahead.
As long as price sustains above key support levels, the next upside targets remain the $150K–$159K range, followed by the upper supply zone between $180K and $185K. Momentum on the monthly chart suggests buyers are still in control, with any short-term pullbacks likely to be viewed as continuation opportunities.
On the downside, one major risk still remains open on the chart: the untested monthly demand zone between $25K and $15K. While this is a low-probability scenario under current bullish conditions, it remains an important long-term liquidity zone if the market faces a deeper corrective cycle.
Overall, Bitcoin remains in a powerful long-term bullish structure, with higher targets active unless key monthly support zones are decisively broken.

Chart Seekers retweeted
🚨 $VET HOLDERS, WAKE UP! 😂
VET has been sleeping so long even the EMA stopped checking on it. 💤
But now the chart is like:
“Guys… I might finally go outside.” 🚀😂
🎯 Resistance: $0.0344
🔥 Next zone: $0.0591
👀 Bull case: $0.14+
Will VET finally break out of the crypto retirement home, or is it going back to sleep? 😂
What’s your target? 👇
Chart Seekers retweeted
🚨 $BTC — IS WAVE 5 FINALLY UNDERWAY? 🚨
The structure is getting interesting… 👀
If our wave count is correct, Wave 5 may have started, potentially setting the stage for the next major BTC move.
But remember: confirmation matters more than prediction. 📊
🔥 What do you think?
Are we already in Wave 5, or is BTC still preparing for one more shakeout before the real move?
👇 Bullish Wave 5 or another trap?
$BTC
#Bitcoin has confirmed a strong monthly close, finishing above the previous month’s candle — a bullish signal that strengthens the ongoing macro uptrend. This monthly breakout keeps the higher-timeframe structure intact and increases the probability of continuation toward the major supply zones ahead.
As long as price sustains above key support levels, the next upside targets remain the $150K–$159K range, followed by the upper supply zone between $180K and $185K. Momentum on the monthly chart suggests buyers are still in control, with any short-term pullbacks likely to be viewed as continuation opportunities.
On the downside, one major risk still remains open on the chart: the untested monthly demand zone between $25K and $15K. While this is a low-probability scenario under current bullish conditions, it remains an important long-term liquidity zone if the market faces a deeper corrective cycle.
Overall, Bitcoin remains in a powerful long-term bullish structure, with higher targets active unless key monthly support zones are decisively broken.
Chart Seekers retweeted
$BTC
People are still waiting for the #bitcoin retest, but as I shared in my video one month ago — $50K is only coming in dreams or in the next bear market.
Once again, the market is proving that the Wave Method identifies moves earlier than any other strategy. While the crowd waits for confirmation, my community already understood the structure and positioned ahead of the move.
The market rewards those who read the waves before the headlines catch up.

$BTC
#Bitcoin has confirmed a strong monthly close, finishing above the previous month’s candle — a bullish signal that strengthens the ongoing macro uptrend. This monthly breakout keeps the higher-timeframe structure intact and increases the probability of continuation toward the major supply zones ahead.
As long as price sustains above key support levels, the next upside targets remain the $150K–$159K range, followed by the upper supply zone between $180K and $185K. Momentum on the monthly chart suggests buyers are still in control, with any short-term pullbacks likely to be viewed as continuation opportunities.
On the downside, one major risk still remains open on the chart: the untested monthly demand zone between $25K and $15K. While this is a low-probability scenario under current bullish conditions, it remains an important long-term liquidity zone if the market faces a deeper corrective cycle.
Overall, Bitcoin remains in a powerful long-term bullish structure, with higher targets active unless key monthly support zones are decisively broken.
Chart Seekers retweeted
$POL Weekly Technical Analysis
POL/USDT is currently trading within a major long-term demand zone around $0.05–$0.08, an area that could serve as a potential market bottom after an extended bearish trend. Price action suggests accumulation is taking place near historical support levels, increasing the possibility of a bullish reversal.
For the bullish scenario to gain confirmation, POL must secure a weekly close above the $0.29 resistance level. A breakout above this zone could initiate the first impulsive move toward Supply Zone 1 ($0.41–$0.49). After a corrective pullback, the next upward leg may target Supply Zone 2 ($0.62–$0.68), completing a projected ABC recovery structure.
As long as the demand zone remains intact, the long-term outlook remains constructive. Traders should watch for volume expansion and strong weekly closes as confirmation of a trend reversal.
(NFA)

Chart Seekers retweeted
🚨 #NIFTY Update
NIFTY is currently facing a key resistance zone, but nothing has changed in the overall technical structure. Price action continues to play out exactly as anticipated.
📈 Gap-up opening is expected tomorrow if global cues remain supportive.

#nifty 📊 NIFTY 50 – Weekly Outlook for Next Week
NIFTY 50 is approached a crucial resistance zone around 24,280–24,420. A sustained breakout and weekly close above this zone could strengthen the bullish structure and open the way toward 24,800–25,200, with the larger 25,220–25,490 supply zone acting as the next major hurdle.
On the downside, 23,800–23,620 remains an important support area. If this zone holds, the index may attempt another upward move toward resistance. However, a decisive breakdown below 23,620 could trigger deeper correction toward the 23,200–22,700 demand zone.
Bias: Neutral to cautiously bullish above 23,800.
Key levels: Resistance 24,280–24,420 | Support 23,800–23,620
Strategy: Watch for a breakout above resistance or a pullback toward support before taking directional trades.
Trade the structure, not the hope. Let the Chart Speak.

Chart Seekers retweeted
#nifty
📊 NIFTY 50 — Daily Outlook
War and ease in oil -related developments are currently supporting market sentiment, helping NIFTY maintain strength and push toward the higher side. Technically, the index is forming a potential A-B-C structure, with Support-1 around 23,650–23,800 acting as a key base.
A sustained move above the 24,300–24,420 resistance zone could open the door toward 24,880–24,975 (Supply Zone-1).
⚠️ However, geopolitical news remains a key risk factor. Any sudden negative development could trigger volatility and profit booking.
Key Levels:
🟢 Support: 23,650–23,800
🔴 Resistance: 24,300–24,420
🎯 Upside Zone: 24,880–24,975

Chart Seekers retweeted
#nifty
📊 NIFTY 50 — Daily Outlook
NIFTY is currently trading near a key resistance zone on the daily timeframe. The price action is showing hesitation around this resistance, while today the volume structure is not supporting a strong bullish breakout.
📉 Our view: The current setup indicates a higher probability of a gap-down opening tomorrow, followed by increased volatility.
🔴 Resistance: 24,041–24,178
🟢 Support: 23,635–23,803
🟠 Major Support: 23,250–23,377
Key Levels to Watch:
A sustained move above 24,178 could negate the immediate bearish setup and open the door toward higher levels. On the downside, a break below 23,803 may increase selling pressure toward the 23,635–23,377 zone.
⚠️ Stay cautious at the open. Let the first few candles confirm the direction before taking any aggressive position. NFA

Chart Seekers retweeted
#NIFTY50 – Next Week Technical Outlook
#NIFTY ended the week on a weak note after closing below the 23,792 weekly support level, indicating that sellers continue to dominate the broader trend. The rejection from the recent swing high around the (B) wave suggests that the corrective structure is still unfolding, with the market now likely progressing toward the (C) wave. As long as the index trades below the 24,275–24,780 resistance zone, the overall outlook remains cautious.

Chart Seekers retweeted
🚨 LIVE TONIGHT | X SPACE | 10:00 PM IST 🎙️
Join Link Below 👇👇
xitter.cf/i/spaces/1qGvvvXlzgeGB…
The crypto market is approaching a critical phase, and we'll break it down live using Wave Theory, market structure, and key technical levels.
📊 We'll discuss:
• Bitcoin, Ethereum & major altcoins
• Current market structure
• High-probability support & resistance zones
#Bitcoin #Crypto #Ethereum #Altcoins #Trading #TechnicalAnalysis #CryptoMarket #XSpaces #ChartSeekers

Chart Seekers retweeted
Link Below👇
youtu.be/-35gSQAMIYE
The ones who truly understand the wave method? Those are the real whales.
While the crowd is busy watching 48K and hunting liquidity, smart money is already steps ahead.
There’s a $btc video breaking this down—watch it and tell me if you see it too.

Chart Seekers retweeted
Google Meet Link Below 👇
calendar.app.google/A5pYtMNG…
#Crypto Therapy Session: Emotional Damage Edition 😭📷 By Chart Seekers | Sunday, April 19, 2026
The charts are wild, the market is unpredictable, and emotions are running high—so let’s talk about it. Join us as we break down the latest moves in Bitcoin and the broader crypto market, share insights, and maybe laugh through the pain together. Jump in, share your thoughts, and survive the volatility with us 📷
🤖 Made with AI

Chart Seekers retweeted
#Nifty50
Complete Technical Analysis for the Upcoming Week – Access the Full Report Below 👇
👉 youtu.be/PC3t6Tmg0h0 👈
