

"Let the Chart Speak" #Crypto #Commodity #Equity All my tweets for education & research purpose only Not a Finical Advice
Global
Joined August 2010
- Tweets3.1K
- Following21
- Followers1.7K
- Likes3.1K





Filter coffee at Cyber Hub ☕
A little coffee, a little market talk, and some thoughts on the next trade. Sometimes, the best ideas come when you slow down and enjoy the moment. 📈
#CyberHub #FilterCoffee #TradingLife #MarketThoughts

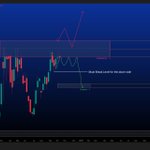
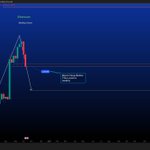
ethereum:native Get your self ready for the deeper correction if the weekly close below the market level in yellow line.

$BTC is trading within a parallel channel 📊
Price action remains range-bound within the channel. The next decisive move will depend on a breakout or breakdown. Until then, patience is key. Let the chart speak! 🎯


$BTC 📊
Sometimes, waiting for the weekly candle to close is the smartest decision you can make.
Patience brings confirmation. Reacting too early can lead to wrong assumptions.
Let the weekly chart confirm the move before making a decision.
Less noise. More clarity.
Let the chart speak! 🎯

$BRENT
🛢️ BRENT CRUDE AT A CRUCIAL LEVEL!
Brent is testing a major resistance zone at $107–$118. The upcoming weekly close could determine the next move.
📈 A breakout could open the door toward $125–$135.
📉 Rejection may lead to consolidation and a retest of $90–$88 support.
No assumptions—waiting for the weekly candle to close. Let the chart speak! 📊

$btc 4 hour C wave T-1 Achieved now the weekly closing improtant and will decide for the next move

$BTC | 4H Technical Analysis 📊
CPI data is the next big trigger today. 🇺🇸
Bitcoin is struggling to break the $84,400 resistance zone. If CPI brings positive momentum and BTC breaks above this level, we could see a move toward $86,400–$86,800.
But remember, the market cannot wait forever! ⏳ The longer BTC takes to break resistance, the higher the chance of another support test near $81,100, with $79,660 as the next key support.
The longer the hesitation, the greater the risk of another shakeout. Will CPI finally give Bitcoin the fuel to break out, or will patience be tested once again?
Let the Chart Speak. 📉📈


🚨 X SPACE TONIGHT: CPI SHOCKWAVE 🌊📊
Link Belwo 👇
xitter.cf/i/spaces/1RKZzBMBOwdKB…
Is Bitcoin ready for its next BIG move? ₿🔥
Inflation data can shake the markets, trigger volatility,
🎙️ Join Chart Seekers tonight as we discuss:
📊 CPI & inflation impact
₿ Bitcoin’s next potential move
🚀 What it could mean for altcoins
🗓️ Wednesday , 14 October 2026
⏰ 10:00 PM IST
Set your reminders and join the conversation! Let’s read the structure and understand the market. 📈
🔔 Follow @chartseekers so you don’t miss it!

$BTC | 4H Technical Analysis 📊
CPI data is the next big trigger today. 🇺🇸
Bitcoin is struggling to break the $84,400 resistance zone. If CPI brings positive momentum and BTC breaks above this level, we could see a move toward $86,400–$86,800.
But remember, the market cannot wait forever! ⏳ The longer BTC takes to break resistance, the higher the chance of another support test near $81,100, with $79,660 as the next key support.
The longer the hesitation, the greater the risk of another shakeout. Will CPI finally give Bitcoin the fuel to break out, or will patience be tested once again?
Let the Chart Speak. 📉📈

bitcoin:native rejected from the daily support again but i am stll looking for the two red candle retracement in the weekly time frame


$BTC | Weekly Technical Analysis 📊
Bitcoin is facing rejection near the $86K–$88K resistance zone, and a short-term retracement may be on the cards.
The chart suggests a possible two-candle retracement, with immediate support around $79K–$81K. If this zone fails, BTC could revisit the $76K area, while the major weekly support lies around $69K–$72.5K.
As long as the broader structure remains intact, this pullback could be a healthy correction before the next move higher. Once the retracement completes and bullish momentum returns, BTC could target the $92K–$100K resistance zone.
Let the chart speak. Patience over panic. 🎯
Chart Seekers | Read the Structure. Understand the Market.
Educational technical analysis only. Not financial advice. Always manage risk and do your own research.


📉 Can the Crypto Bull Run Happen Without $WLFI?
WLFI is still consolidating near its lows after a massive decline from its launch highs. The weekly chart shows price struggling to build momentum inside the $0.047–$0.075 zone.
Will this pair eventually wake up, or will it remain forgotten while the rest of the market rallies?
My question to the crypto community:
🚀 Can we have a full-fledged altcoin bull run without $WLFI participating, or will this pair surprise everyone?
👇 What's your view?
