
Data Visualization Developer @UrbanInstitute (views my own) | He/him
Philadelphia, PA
Joined January 2017
- Tweets297
- Following852
- Followers285
- Likes1K






Attention @datawrapper power users! I built a @raycastapp extension just for YOU! This extension allows you to view, search, open, and duplicate your Datawrapper #datavisualization anywhere on your Mac! Check it out and let me know what you think!
raycast.com/benkates/datawra…


Ben Kates retweeted

New Unwrapped speaker! @benkates, data visualization developer at @urbaninstitute, will share how he used Svelte to extend Datawrapper tooltips like in the video below.
Learn more about Ben and sign up for Unwrapped (for free!) here: blog.datawrapper.de/urban-in…
Ben Kates retweeted

Surveys and other data systems still rely on binary terms Male/Female. We are way overdue for a change. After digging into alternative ways to quantify our identities, Fe Simeoni made two data structures to better reflect the fuller #lgbtqia spectrum.
nightingaledvs.com/querying-…

I've been working on my first complex @d3visualization project for the last month and I have to say the #rstats data manipulation skills I've developed work so well with the "custom" aspect of custom viz! Very fun!
I’ve been on clubhouse for 20 minutes. I’ve never been to sxsw talks but I imagine this is exactly what it’s like
Ben Kates retweeted

Wanted to look up jobs data for gender *and* race and visualize it. Here you go:


US employers cut 140,000 jobs in December, according to the latest jobs report. Women accounted for all the losses, losing 156,000 jobs, while men gained 16,000. cnn.it/38q7I0N

#immersiveanalytics is the future! Here's a roundup of some of our research into the space! #datastorytelling #AugmentedReality

Check out @benkates new blog post around Data Visualization in AR/VR. Hear more about the product leaders in the space and how CompassRed and @DDIL_de are exploring this new field.
#VR
bit.ly/363zIpH
I love online music communities, especially on Twitch. New infographic on the rise of virtual music appreciation this year, built in #GoogleDataStudio!
datastudio.google.com/report…
Had a #recentgrad reach out and ask how necessary certifications are for getting that first analyst job. I said understanding of the analyst role + portfolio > certifications, what do you think?
#data #rstats #Tableau #GoogleAnalytics

Well I now have an excuse to share my love of mechanical keyboards, thank you @sharlagelfand for creating such a fun #rstats package! Got pretty close recreating mine in ggplot!
Frame: Filco Majestouch 2 w/ Silent Red Cherry MX Switches
Keycaps: Jessica GMK Plum from Massdrop


You’re unable to view this Post because this account owner limits who can view their Posts. Learn more
Ben Kates retweeted

Are you interested in using R Shiny Apps? @benkates breaks down our favorite skins in this post ->
bit.ly/3g93xI8
#Rstats #DataScience #Data #DataViz

Just spent a little while digging into this tool - a really impressive "big" #rstats #shiny project.
Aside from showing very important data from multiple sources, the frontend/UX is unique and makes use of multiple packages to tie everything together really nicely. Great work!

Last week, our team at @Texas2036 launched a comprehensive dashboard the tracks COVID-19 impacts across the state of Texas and all of its 254 counties. This week, we've added @Google's #COVID19 mobility reports for the state and all available counties.
covid19.texas2036.org
Liked the use of these in particular:
📦metathis: SEO/social media sharing friendly tags
📦shinyLP: nice landing page (LP) experience
📦highcharter: charts, great custom theming
📦leaflet.extras: what it sounds like :)
📦waiter: loading screens
📦sever: disconnected screen
Repo found here! github.com/texas-2036/covid_… (👀 the size of the app.R file)
Excellent overview video of new #GoogleMaps in #GoogleDataStudio from @RiccardoMuti and Tech Writer Rick! youtu.be/msMJaF-7rhI
Excited to share a #GoogleDataStudio report focused on #selfcare during the #COVID19 pandemic. Hope everyone is doing their best to take good care of themselves and others!
Medium: medium.com/compassred-data-b…
Report: datastudio.google.com/report…
#infographic #selfcare @GoogleTrends
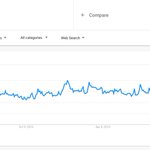
I've been looking at a lot of #GoogleTrends recently and was surprised to see such a drop in interest for the "Vegetarianism" topic in the US
