

Meteorology Student | A.S. Degree | NCSU ‘28 | North Carolina Piedmont-Triad
Burlington, North Carolina
Joined October 2019
- Tweets914
- Following377
- Followers787
- Likes2.7K






George retweeted

Will this year's record-shattering El Niño event be the strongest in a millennium?
In a new piece over at The Climate Brink I review the paleoclimate literature from tree rings and corals and argue that may well turn out to be the case.
(link below)

George retweeted

As a direct appeal to WeatherBell users out there. Consider my website as an alternative. Why pay 30 a month when you can get the same or better for 2-5 a month?
Please help spread the word if you enjoy my work, I want to succeed but I need enough users to cover my costs!


Playing around with some QGIS mapping. It’s a chilly evening out there… according to the 00z GFS initialization

I love how people are reposting something I tweeted in 2020. Maybe this is my sign to go back on Twitter

George retweeted

Once again, I decided to have a little fun in Python 🐍 today & created some Dec-Jan-Feb-Mar CONUS surface temp & 500mb height anomaly probability + mean composites for El Niños since 1855 using NOAA's 20th Century Reanalysis!
Unlike the previous set of composites I showed in early October, these composites include more El Niño events (53 in total).
Also, weights have been applied to account for El Niño strength (1x - moderate, 2x - strong-"Super"), a negative Pacific Decadal Oscillation (-PDO), Positive Indian Ocean Dipole (+IOD), Positive Atlantic Multidecadal Oscillation (+AMO, or a warm Atlantic), and appearance of a negative North Atlantic Oscillation (-NAO) in December
As you can imagine, these new composites are more favorable looking for snow lovers over the Eastern US
☃️❄️


George retweeted

I've been experimenting with creating various ERA5 climatologies recently. To make sure the results look as expected, I plotted the daily change in average 2m temperature, nicely showing the contrast between land & water, as well as the change in seasons and monsoon/ITCZ:
George retweeted
Decided to have a little fun in Python 🐍 today & created some Dec-Jan-Feb-Mar surface temp & 500mb height anomaly probability + mean composites for moderate-strong or east-based El Niños since 1870!
To provide a more apples-apples comparison for the near-150 years worth of El Niño events & account for climate change, I created a 30-year sliding base period in NOAA 20th Century Reanalysis Version 3 that lags significantly behind each year.
This is typically how today's climate anomalies are perceived & forecasted (relative to the most recent 30-year climate period (e.g. 1991-2020)).
#climate #ElNino


Here are the archived Euro runs for the December 2010 Snowstorm. It's interesting to see that the Euro was much too overzealous with regard to snowfall, especially far south. Even when we "lost" the storm, there was still accumulation. @rysheely


Here's the z500 view of the January 1940 snowstorm; The holy grail of southeast snowstorms
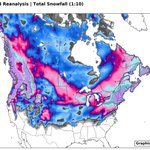
On the topic of ECMWF datasets, I discovered the CERA-20C, which goes back to 1901, and seems to be more reliable than ERA20C. I plotted the March 1927 Snowstorm. @webberweather you may appreciate this

On the topic of ECMWF datasets, I discovered the CERA-20C, which goes back to 1901, and seems to be more reliable than ERA20C. I plotted the March 1927 Snowstorm. @webberweather you may appreciate this