

http://t.co/UtPhDlA4gv is a community of creative people working to make sense of complex issues through data and design
Worldwide
Joined June 2010
- Tweets1.5K
- Following584
- Followers13.4K
- Likes52




Visualizing retweeted

Wrote a blog about to design proces of my winning #D3js entry to the @VisualizingOrg challenge visualcinnamon.com/2015/04/v…

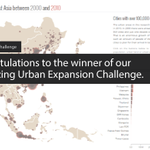
Congrats @NadiehBremer on winning the @WorldBank Visualizing Urban Expansion Challenge. invent.ge/1I0ZR71


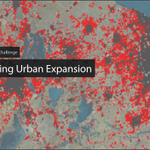
Less than 5 weeks left to submit for our Urban Expansion #dataviz challenge w the @WorldBank. invent.ge/1zGaXZ4

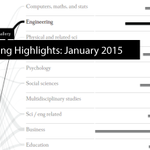
NEW GALLERY: Visualizing Highlights — our top #dataviz picks for January 2015. invent.ge/1Kv0x1m

CHALLENGE: Visualize urban expansion with data from @worldbankdata. invent.ge/1K5kcok


Archer Net: The relationships of characters on FX's Archer — by David Lee. invent.ge/1wb29Fy

US Bachelor Degrees by Gender and Ethnic Diversity — by @SamSpottingTime. invent.ge/1wCsZb4


NEW GALLERY: Visualizing Highlights — our top #dataviz picks for December 2014. invent.ge/1rxGDPR

Mapping Service Experience Camp — by Johannes Schleith, Kurt Steinwald & @ftwk. invent.ge/1wyFDqh

Visualizing 2014: A look at the year's major events and trends through #dataviz invent.ge/13AOTTS


Explore 200+ years of life expectancy and income indicators — by @romsson. invent.ge/1GsZKxF

