

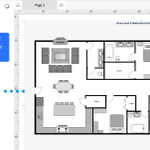
Easy floor planning and scaled drawings without CAD complexity. Plus get traditional diagrams for your enterprise.
The Woodlands, TX
Joined July 2008
- Tweets6.9K
- Following2.6K
- Followers3.1K
- Likes367




SmartDraw retweeted

Worried about skyrocketing renewal costs?
@SmartDraw replaces Lucidchart, Visio & Miro starting at just $5 per user/month. Cut costs, not capabilities 💸✂️
✅ Checks every box
✅Save 75%
✅Control your own data
#ITOps #Collaboration #Diagramming
👉 bit.ly/3EljSed

SmartDraw retweeted

@Atlassian‘s @Confluence is the best knowledge base, enabling concurrent editing of text, images, charts and diagrams for all teams. So we’ve reviewed the big four Charting apps @drawio, @lucidchart, @gliffy, and @SmartDraw, and their integrations oldstreetsolutions.com/post/…
SmartDraw retweeted

5 Tips for a Happier Work Day by @SmartDraw 😃 📈 smartdraw.com/productivity/f…
SmartDraw retweeted

The large scale Program Increment (PI) Planning events held by Arm IT presented a unique challenge: maintain visibility once the planning event was over. So Arm IT used ScriptRunner and VisualScript to digitize the program boards. #SAFe #scaledagile bit.ly/2Dtk60b

SmartDraw retweeted

Five Secrets of Great #Leaders Who Get the Most Out of #Meetings - SmartDraw Blog | Collaboration smartdraw.com/collaboration/…
SmartDraw retweeted

Strategic Planning. Are you doing it, or only reacting in the moment? Good thoughts from @SmartDraw smartdraw.com/management/str… #strategicplanning – at Quincy, MA
SmartDraw retweeted
Here's our recap of META-INF's Atlassian Day in Budapest. VisualScript embraces agile when it comes to data visualization. It's designed to visualize data unique to DevOps as trees, hiearhies, and relationships. Read more. bit.ly/2MLgOMR #dataviz #agile #devops

SmartDraw retweeted
VisualScript relies on some simple, rule-based mechanisms to connect shapes so you can generate even complex data visualizations that show hierarchy and relationships with just a few lines of code. Learn more. #devops #dataviz bit.ly/2QVk9r3

SmartDraw retweeted

Thanks for having us @metainf! We had a great couple of days chatting about ScriptRunner and VisualScript, and we're really grateful for everyone who came to see us speak or chat to us at the booth. If you want to follow up about anything 👉 adaptavist.com/contact/ #jira


SmartDraw retweeted
Learn about all the building blocks of VisualScript and see how to generate visuals that show hierarchy and relationships in your #DevOps data. Add your visual report to a Jira dashboard or a Confluence page. bit.ly/2WpP4ln

SmartDraw retweeted
You can create a custom data visualization for Jira or Confluence using the built-in Script Editor or point to a REST endpoint made with ScriptRunner or any other scripting tool. See how you visualize DevOps with VisualScript Studio. bit.ly/2MtxOqK

SmartDraw retweeted
The VisualScript SDK provides an object model that allows a developer to build a VisualScript document. This is the basis for creating custom data visualizations. The SDK is built into the included Script Editor, but you can also get it for C# & Java. bit.ly/2HZ6OeJ

SmartDraw retweeted
What is VisualScript? It's a markup language that makes it easy to visualize relational data as flows, trees, timelines, and other designated formats without using coordinates. VisualScript makes it easy to create custom reports and #dataviz for #DevOps. bit.ly/2EvTDQ1

SmartDraw retweeted
On Thursday, our VisualScript Product Marketing Manager Jimi will be at Meta-Inf Atlassian Day, talking about how visualing your data can optimize your DevOps lifecycle. atlassianday.meta-inf.hu/ses… #DevOps #datavisualisation #SAFe

SmartDraw retweeted
Collaboration is the cornerstone of Agile success. Here's how @Arm IT used ScriptRunner and VisualScript Studio to visualise their Program Increment (PI) program boards to improve collaboration and efficiency
adaptavist.com/blog/how-arm-… … #visualdata #DevOps #SAFe

SmartDraw retweeted
Show the hierarchy of a single project as a visual to reveal relationships and potential resource issues at a glance. What are you struggling to understand or report on? See what's possible and let's talk about how we can help. #devops #dataviz bit.ly/2YsRNHh

SmartDraw retweeted
If you could see how issues are related and dependent on each other at a glance, you could more easily pinpoint a potential choke point or bottleneck. #dataviz #devops #agile bit.ly/2E8wFOE

SmartDraw retweeted
Producing insightful, accurate and timely visibility into your DevOps ecosystem pays big dividends in terms of overall DevOps goals. Find out what other DevOps managers think those benefits are. #devops bit.ly/2VHQab4

SmartDraw retweeted
We fielded a survey in advance of the Atlassian Summit in Vegas last week. We heard from 200 senior DevOps professionals. 84% said it was somewhat to extremely important to "provide real-time DevOps visibility across your DevOps ecosystem." bit.ly/2L4Wm8G

SmartDraw retweeted
DevOps is meant to be agile. With high amount of project turnover, visibility into key operational data is easy to mismanage and can lead to mistakes, lack of optimization, and organizational misalignment. Four ways you can improve visibility into #DevOps. bit.ly/2GBWfwc
