

Tweet dedicati al sentiment dei mercati finanziari, grafici sul sentiment e sullo spessore
Rimini, Italia
Joined June 2011
- Tweets33.5K
- Following653
- Followers910
- Likes1.5K





Sentimentcharts retweeted

The CNN Fear & Greed Index (blue line) plummeted to 17.9 Friday, the least since April 1st, from 45.0 a week ago, falling into “Extreme Fear”.
All seven indicators are below Neutral with six in Extreme Fear.
Extreme Greed = None
Greed = None
Neutral = None
Fear = junk bond demand (vs investment grade) (from Extreme Greed)
Extreme Fear = market momentum (SPX vs 125-DMA) (from Greed); stock price strength (net new 52-week highs); stock price breadth (McClellan Volume Summation Index); put/call options (5-day put/call ratio) (from Fear); market volatility (VIX & its 50-DMA) (from Neutral); safe haven demand (20-day difference in stock/bond returns) (from Greed)


The Week Ahead – The Rotation Continues
AI worries are pressuring Tech and sending yields lower as we embark on a heavy earnings week including several names in the cross-hairs.
pro.thestreet.com/market-com…

Sentimentcharts retweeted

"We are currently in peak earnings blackout, with just 24% of S&P 500 index weight outside repurchase blackout windows. That figure rises to ~55% by month-end, ~75% by November 3 (Midterm Election Day), and ~85% by November 9"
-Scott Rubner, Citadel

Sentimentcharts retweeted

When a magazine puts the market on its cover, it's usually time to do the opposite.
63 magazine covers over 24 years is a thin sample, roughly two and a half a year, so I wouldn't lean too hard on this chart in isolation.
That said, I've come across other studies with larger samples that land in a similar place: by the time a bearish cover hits the newsstand, much of the pain tends to be behind us, and bullish covers have a habit of showing up near the top.
I think investors are best served by using the entire toolkit available to them. Fundamental analysis, technical analysis, sentiment and perception analysis, data-driven insights, boots-on-the-ground research and plain common sense each catch things the others miss.
Being a contrarian works, as this chart illustrates, and the magazine cover indicator is one small piece of the sentiment puzzle we try to solve when looking for signs that a bottom is near, whether in an individual stock or a broad index.
On individual stocks, @SixSigmaCapital recently wrote a great thread on how he times his entries, and social media sentiment plays a part in it. In many ways, the tone on X and SS is the modern proxy for the magazine cover.
I'd add one caution. Fintwit is its own echo chamber, and the mood in our corner of the internet doesn't always reflect how the broader investing public feels.


Sentimentcharts retweeted

$SPX barely moved, but gamma exposure dropped 43% in a single session.
From Oct. 9 to Oct. 12, SPX slipped just 0.06%, while GEX fell from +$12.84B to +$7.34B.
GEX remains positive, but there may now be less of a cushion against index swings.
sentimentrader.com/light-dat…


Sentimentcharts retweeted
BBG: "The MSCI All-Country World Index has stalled since hitting a record in mid-August, even as analysts continue to raise earnings estimates.
"While that has made stock valuations lower than average, market participants worry that a slowdown in consumer spending will crimp broader economic growth."
bloomberg.com/news/articles/…

Sentimentcharts retweeted
The S&P 500 is up 131% on a total return basis the past four years.
85% of those gains came from earnings and another 33% from dividends.
In other words, multiple expansion isn't the reason for the gains and you could argue this isn't an overvalued market at all. Yes, there are some scary charts that make it appear to be overvalued, but we'd disagree.

Sentimentcharts retweeted
Goldman: We maintain our base case that continued adaptation of Mideast supply will eventually reduce crude oil prices (Exhibit 2), while potential renewed escalation still poses significant net upside risk.
We nudge up our Brent Dec26 price forecast to $90 (vs. $85 prior) because ongoing downside risks to supply likely slow the moderation in the near-record timespreads risk premium—which we estimate at just over $20 today.
The risk premium also took about three quarters to come down sharply in 2022 after Russia's invasion of Ukraine until the market had sufficient evidence that Russian oil production was unlikely to plummet at all (Exhibit 3).

Sentimentcharts retweeted

Global EPS revisions remain positive, though leveling out a bit ahead of the Q3 reporting season GS

Sentimentcharts retweeted
Goldman: this week we highlight a difference in market’s perception and cost of skew … VIX upside convexity has gone extremely bid while SPX downside convexity remains very offered …
as a colleague on our index vol desk said, “there is almost a higher probability of VIX 25+ than there is of SPX -2%” … we have lived in a word of very low realized correlation and very high dispersion, reflected in the two metrics.

Sentimentcharts retweeted
"Investors are aggressively betting on a sudden turnaround in interest rates, and they're using call options on exchange-traded funds tied to utilities stocks and long-dated Treasury bonds to do it."
-MarketWatch, h/t @neilsethinew

Sentimentcharts retweeted
Goldman: Our macro model for S&P 500 P/E valuation incorporates Treasury yields, inflation, and return on equity (“ROE”) as a measure of corporate profitability.
Today’s P/E of 19x is about 10% lower than the multiple those macro and fundamental variables would imply today. We think this reflects justifiable market skepticism regarding the sustainability of current profitability but not an overly pessimistic earnings outlook.
Given current inflation and interest rates, today’s S&P 500 multiple of 19x would be consistent with an ROE of roughly 22%, more than 200 bp below the current level but otherwise matching 2021 as the highest on record.

Sentimentcharts retweeted
"Midterm years see the strongest Q4 on average, gaining +6.6%."
@mattcerminaro

Sentimentcharts retweeted
"One of the main reasons so many breadth indicators are off the charts is because the concentration in the index is like nothing we've ever experienced. The top 5 stocks in the S&P 500 are equal to the bottom 434. (67-500)"
@michaelbatnick

Sentimentcharts retweeted
Still, though, waiting for the McClellan Summation Index (red line, broadly whether the typical stock is doing relatively better or worse than the index) to turn higher, but at least it’s stopped going down.


Sentimentcharts retweeted
"CFTC data (through Sep 29th) shows that non-dealers have sold SPX futures for five of the last six weeks. Over that timeframe, they have sold -$68bn worth of futures. That marks one of the most aggressive bouts of selling on record."
-Cullen Morgan, Goldman Sachs

Sentimentcharts retweeted
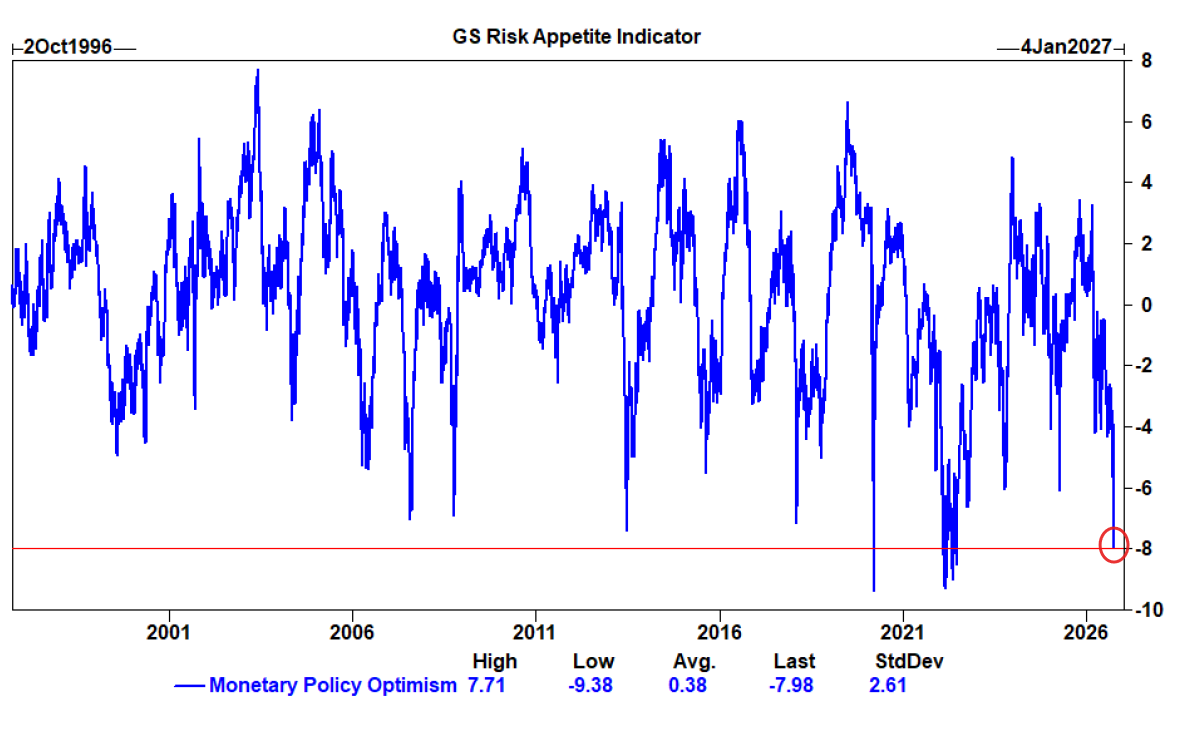
Goldman: The macro backdrop continues to drive price action, with the markets focus on rates/oil leaving positioning depressed across the board – especially in vol. The internals are starting to look much more washed out than the headline index suggests.
Our GS Monetary Policy Factor is at -8, basically at the bottom-end of the last 30 years (a lot of policy pessimism is reflected in the macro complex).
The Week Ahead – Do We Finally Get the Broadening?
Yields remain in the driver’s seat, with bond shorts at extremes and a light week on the calendar.
pro.thestreet.com/market-com…


Sentimentcharts retweeted
MS' Mike Wilson continues to look for broadening saying “[p]arts of the asset-heavy universe are beginning to look more interesting after recent de-rating," particularly industrials where he says recent selling has created a "better setup".
“Broadening backlogs across machinery, fabricated metals and other categories are improving revenue visibility and supporting a shift back into higher-quality industrials,” they wrote.
Wilson noted that lofty expectations were “creating a high bar” for many companies keeping the S&P 500 stuck in a tight range even as earnings estimates keep rising. “We expect earnings quality, free cash flow and revisions breadth to be the key differentiators.”


A steep drop in US stock valuations has left some areas of the market looking attractive, according to Morgan Stanley strategists bloomberg.com/news/articles/…

Sentimentcharts retweeted

Oil flows in the Strait of Hormuz have sharply rebounded:
Persian Gulf crude oil exports surpassed 14 million barrels per day last week for the first time since the Iran War began on February 28th.
This marks an over +210% increase from the ~4.5 million barrels per day low seen in March.
As a result, the 4-week average is up to 14 million barrels per day, the highest level in 6 months.
Persian Gulf crude oil exports have now recovered to ~80% of their pre-war levels.
This comes as the US military has increasingly secured the Strait of Hormuz and established a two-way shipping corridor along the coast of Oman, allowing oil convoys to resume through the waterway.
Meanwhile, refined fuel shipments, including gasoline, diesel and jet fuel, remain at only around 50% of pre-war levels, as these products are more expensive to transport than crude oil and some refineries in the Persian Gulf that were damaged during the early stages of the war have also yet to fully resume operations.
Oil flows are coming back, but the fuel market is still under intense pressure.
