Lets make some money
MSTR, Bitcoin Trade Alerts →
Joined August 2013
- Tweets6.7K
- Following894
- Followers18.9K
- Likes42.6K





$ASST Weekly Expected Move (Options IV) 10/19 → 10/23
1σ Base Range: ± $2.88
• 📈 Upside: $26.97
• 📉 Downside: $21.21
2σ Range:
• 📈 $29.85
• 📉 $18.33
3σ Range:
• 📈 $32.73
• 📉 $15.45
🤖 Made with AI

$MSTR Weekly Expected Move (Options IV) 10/19 → 10/23
1σ Base Range: ± $12.70
• 📈 Upside: $149.53
• 📉 Downside: $123.13
2σ Range:
• 📈 $162.23
• 📉 $111.43
3σ Range:
• 📈 $174.93
• 📉 $98.73
🤖 Made with AI

💸 Trade Bitcoin/crypto perpetuals on Kalshi, get $50: kalshi.com/p/ryanhogue
👉 Trade $50 in the next 24 hrs, 1 person gets $500

History Repeats: Why This $MSTR & Bitcoin Pullback Precedes Massive Rallies 🚀

$MSTR & Bitcoin Are Flashing the EXACT Setup That Preceded Historic Rallies 🚀

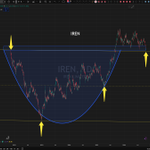
I think today may have offered one of the best entry opportunities on $IREN .
And the implications could extend well beyond IREN itself. 👀
After completing a massive multi-year rounding bottom and breaking out above ~$30, IREN is now backtesting that former resistance as support.
Previous resistance → New support?
If this level holds, I think it could be a major clue about what comes next for $BTC, $MSTR, and other Bitcoin-related equities.
Pay attention. 📈


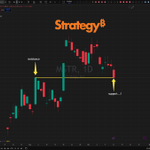
🚨 $MSTR is backtesting previous resistance at ~$144.80.
A level that previously rejected price is now being tested as potential support.
Will previous resistance hold as support...? 👀

$ASST Weekly Expected Move (Options IV) 10/12 → 10/16
1σ Base Range: ± $2.86
• 📈 Upside: $30.66
• 📉 Downside: $24.94
2σ Range:
• 📈 $33.52
• 📉 $22.08
3σ Range:
• 📈 $36.38
• 📉 $19.22
🤖 Made with AI

$MSTR Weekly Expected Move (Options IV) 10/12 → 10/16
1σ Base Range: ± $12.63
• 📈 Upside: $166.97
• 📉 Downside: $141.71
2σ Range:
• 📈 $179.60
• 📉 $129.08
3σ Range:
• 📈 $192.23
• 📉 $116.45
🤖 Made with AI

Ryan Hogue retweeted

$BTC is setting up for a 2013/2017-style blow-off top, completing the final impulsive (4)–(5) advance.
2026 target: $450K–$500K, marking the pre-recession macro peak before the first true secular bear market.


🚨is $MSTR coiling for its next big move?
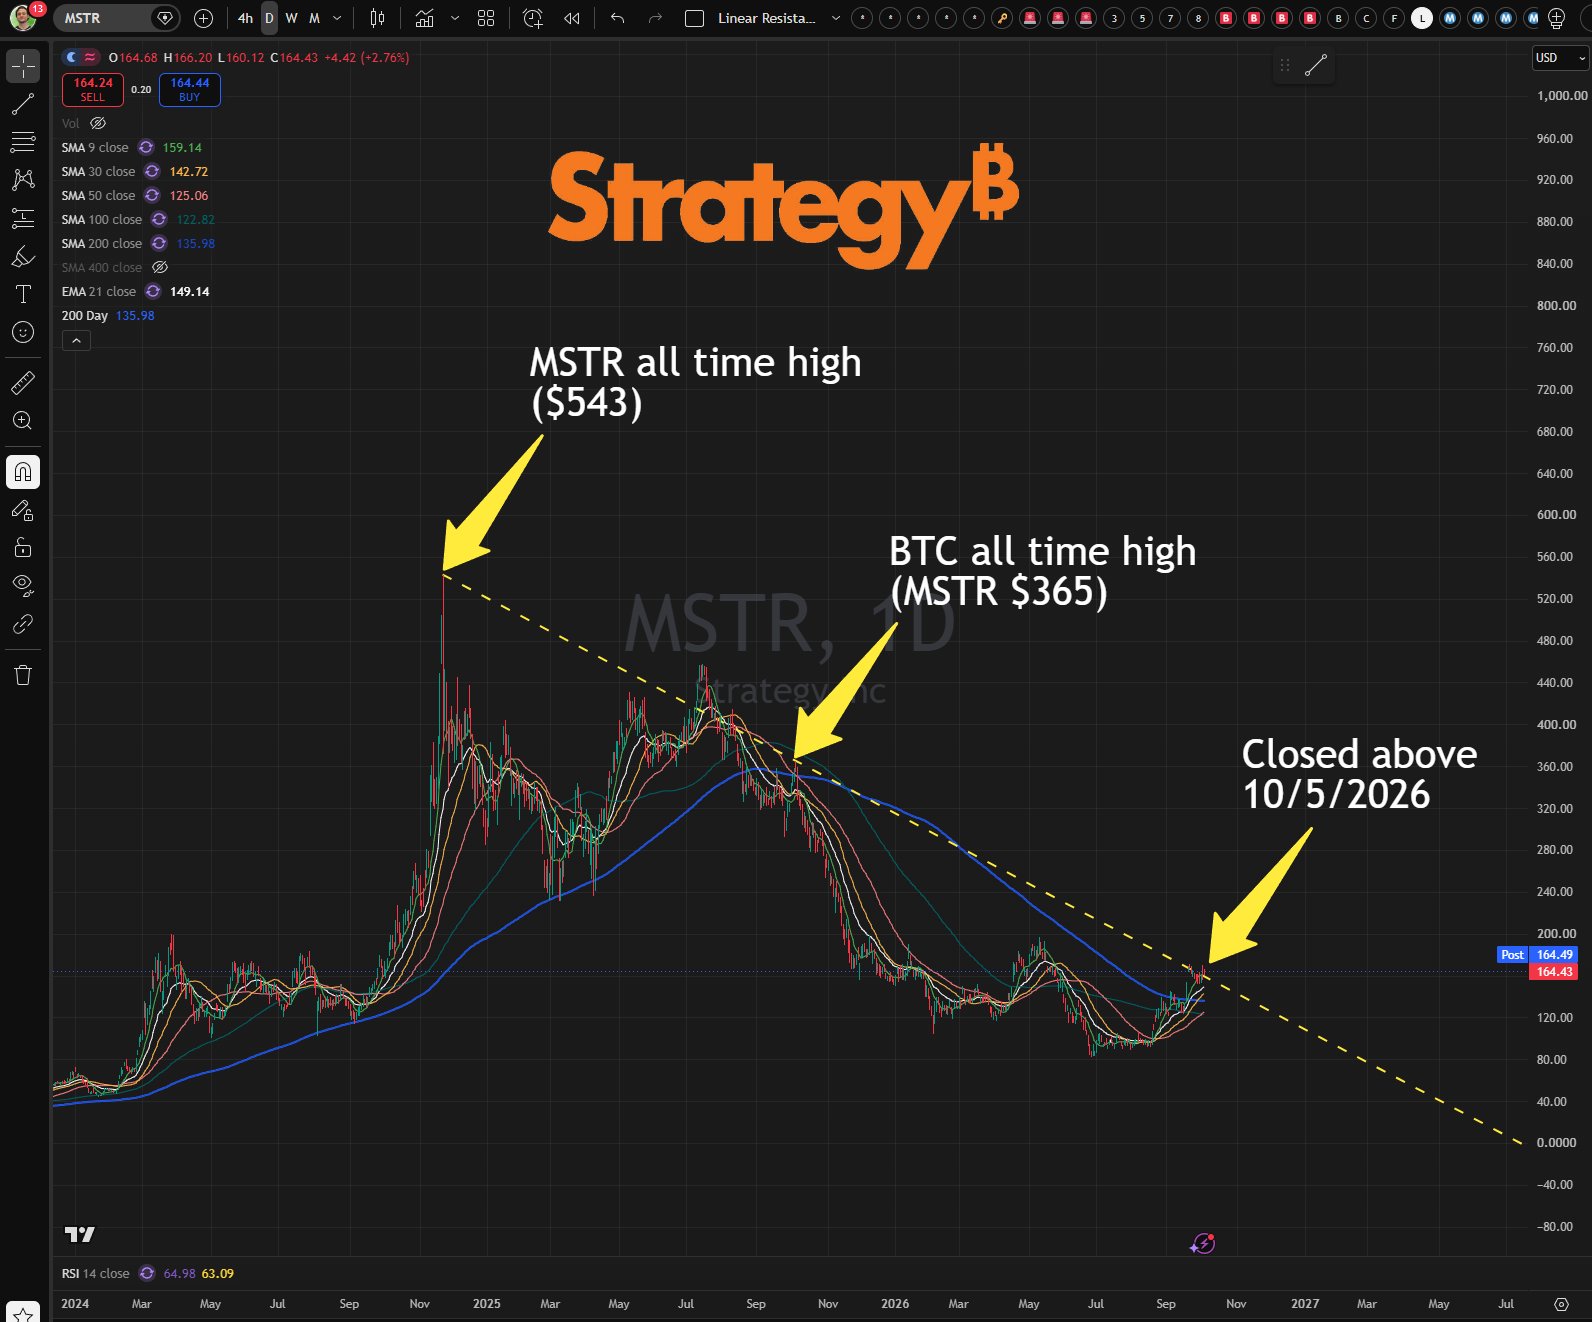
Since September 19, MSTR has been consolidating around the 50% midpoint of its massive descending channel, stretching from the $543 all-time high to the $82 bear market low.
What's caught my attention:
🟢 Recent downside moves have been relatively muted
🟢 Price continues to hold near the channel midpoint
🟢 The 200-day moving average turned up for the first time since September 2025
Is MSTR building energy for an explosive next leg higher? 👀📈

🚨As of yesterday, $MSTR ’s 200-day moving average is officially rising again.
Its rate of change just flipped positive for the first time since September 2025.
The long-term trend is no longer in decline. 📈


$MSTR just got a daily close above the downtrend connecting its $543 all-time high to its $365 peak when Bitcoin hit its all-time high.
Clean break. Will follow-through come next? 👀📈