

Weather/climate analyzer and forecaster. Info on global weather models, weather patterns, winter, stratosphere, polar vortex, custom graphics, and more...
Slovenia
Joined July 2010
- Tweets2.9K
- Following217
- Followers1.8K
- Likes2.8K





Pinned Tweet
A split Polar Vortex in early November? 👀
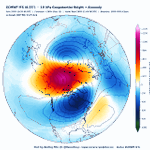
The latest ECMWF 00z shows two vortex cores/lobes at 10mb, over northern Eurasia and Canada, with a wave-2 ridge cutting in-between. The same pattern reaches down to 50mb, so it’s not just an upper-level feature, but an upward reflective event.
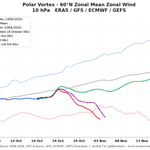
Both ECMWF and GFS push 60°N/10mb winds below the historical minimum (5–11 m/s by Nov 4-5).
Even the GEFS extended mean, with its usual strong-SPV bias, is trending weaker in the latest available data.
#PolarVortex #Winter2026


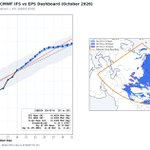
Thanks to a big jump in the latest IMS snow analysis, the latest SAI forecast and the final slope estimate got a bit of a boost in the latest run, showing a decent above average Snow Advance Index.
NOTE: There are some changes in the IFS snow depth (sd) parameter packaging since the 12z run, along with the addition of 0.1° model output. Effectively, they slightly increased the minimum SWE (snow-water equivalent) threshold needed before a grid box is marked as snow-covered, though calibration against observations keeps the forecast curve in check.
@judah47

Polar vortex outlook for winter 2026/27: El Niño analogs vs ECMWF SEAS5 🌀
Polar cap (60-90°N) temperature anomaly, Oct-Apr, from the surface to the stratosphere.
📊 Analogs (strong East-Pacific El Niño years 1997, 2015, 1982, 1957; NOAA CORe):
A cold, strong polar vortex from November through most of January. Then a sharp stratospheric warming in late January / early February that works its way down towards the lower stratosphere by March.
ECMWF SEAS5 (October run, 51 members):
The same overall story: a cold vortex in November and December, then a strong warming signal that arrives earlier, from late December, peaking in January and reaching below 100mb by February.
The takeaway: both point to a strong vortex in early winter, followed by a vortex disruption in mid-to-late winter. The main difference is timing: SEAS5 brings the warming about a month earlier than the analogs.
A weaker vortex in late winter raises the odds of a negative AO / NAO pattern and cold outbreaks into mid-latitudes, but the timing is uncertain at this range.
Also, the analogs are only 4 years, with high variance.
@judah47 @webberweather @RyanWeather


Pattern repeat: how the 500 mb pattern evolves from November to December in strong East-Pacific El Niño analog years 🌍
ERA5 analog composite for 2026/27 (1997, 2015, 1982, 1957), weighted by how closely each year's Jul–Sep SST pattern matches 2026.
🇺🇸 United States: the November pattern repeats and amplifies (r = 0.61).
Both months show lower heights over the West and South and a ridge over the East. In November it's a trough over the Southwest and a weak East Coast ridge. In December the trough slides towards Texas and the Gulf, and the ridge grows into a strong high over the Great Lakes and the Northeast. Upstream, a deep low develops over Alaska and the Bering Sea, the classic strong El Niño signal. That means a mild northern and eastern US, with the storm track favoring the southern tier. This is something that @webberweather already mentioned as "Merry Torchmas"
🇪🇺 Europe: the same pattern in both months (pattern correlation r = 0.91). High pressure is anchored over central Europe in November and simply strengthens into December, spreading across the Alps, the Balkans and the Mediterranean. The Atlantic trough stays in place but shifts north, from west of Ireland towards Iceland, keeping the storm track over the northwest. That points to a persistent mild and mostly dry regime for central and southern Europe, wetter for the British Isles and Norway.
The bottom line for both regions: whatever sets up in November tends to lock in and strengthen into December. Keep in mind that analogs show tendencies, not forecasts.


The latest SAI forecast is starting to adjust into reality, while exhibiting a positive snow area bias over much of the month.
The forecast still ends at an above average SAI. @judah47

The Polar Vortex is about to take a big hit 🌀📉
After a short boost to 22 m/s around Oct 24, both ECMWF and GFS show a sharp deceleration, with 10mb zonal winds dropping to 8–10 m/s by early November. That’s below the 1958–2025 record minimum for the date.
At the same time, the GEFS extended range forecast is completely clueless about what's going on, and as usual, exhibits a positive bias.
#PolarVortex #Stratosphere

The latest forecast update on the October SAI snow advance in Eurasia still shows an above-normal snow advance trend. @judah47

I was experimenting with SEAS5 seasonal data to see what it has for SAI, based on the great work by @judah47 . To keep it simple, a higher SAI favors a negative winter AO and/or a potentially more disrupted #winter circulation.
Data shows a positive SAI upslope, but it's not ideal with a 1° data grid.
And whether it's related or not, the October SEAS5 data also shows a significant deceleration of the Stratospheric Polar Vortex in mid-winter for a 3rd consecutive run now, which is remarkable in itself and likely a sign of being more Super El Niño-related. All strato plots use the model's own hindcast climo.
Looks like a very dynamic stratospheric Polar Vortex season is ahead for Winter 2026/2027


The latest July 2026 ERA5 ranking for zonal winds at 850 mb is remarkable, ranking among the strongest or in the top 5 across a large region in the 1940-2026 dataset. This reveals the massive westerly wind bursts in the western tropical Pacific, which have enabled the development of a powerful subsurface warm anomaly, boosting the still-growing Super El Niño seen on the surface.

ALT Globe map centred on the tropical Pacific showing 850 hPa zonal wind rankings for July 2026 versus the full ERA5 record (1940–2026). A vast band of record-strongest westerly winds (red) stretches across the equatorial Pacific, flanked by top-5 values (orange), indicating an exceptionally strong low-level jet this July. ENSO monitoring regions are outlined, with Niño 3.4 highlighted. Data: ECMWF/ERA5.
Comparing some of the latest forecast runs to past strong El Niño events shows we are in for quite a historic ride, if verified. Both the BOM and CFSv2 use the Relative ENSO index forecast. Interesting to see how close the new BOM forecast is to the ECMWF.
@AndyHazelton
@webberweather
@PaulRoundy1
@tcrawf_nh
@BenNollWeather


Looking at the latest snapshot comparison to the last 2 Super El Niño events, we can see a significant speedup of the subsurface warming evolution in 2026 compared to the start of the month.
@AndyHazelton
@webberweather
@PaulRoundy1
@tcrawf_nh


This is now also the revised plot for the older two Super events, comparing the late April 2026 data to April monthly means, and the second graphic is the forecast for May 5-9, 2026, compared to the May monthly mean for past events. The forecast comes from the Mercator Ocean International system, forced by ECMWF IFS.


Looking at the month-to-date comparison to the last 2 Super El Niño events, we can see how big the OHC delta is in the western Pacific. Likely a stronger buildup, or perhaps just a time difference in the process evolution? @AndyHazelton @webberweather @PaulRoundy1 @tcrawf_nh

The final comparison is a simple subtraction of anomaly fields, which shows the true delta between the events, with a much stronger western OHC in 2026, and a closer resemblence to 1997 than 2015.

I decided to also load the zonal flow data for depth, and overlay the 2026 with the latest mean, and also do a comparison where/how the 2026 shows stronger/weaker zonal flow compared to past events. Will be really interesting to see the 2026 analysis plot in a week or two after the upcoming round of WWBs. But overall, stronger westerlies in the west are evident versus all years.

