

NQ, ES & Gold futures | Probability over opinion | ICT + backtests | TradingView indicators | https://xitter.cf/t.co/pruz2NQ6Tu | https://xitter.cf/t.co/7xIEUoPhSw
- Tweets19.6K
- Following232
- Followers13.7K
- Likes31.2K


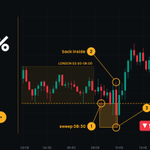


ALT TradingView chart showing a London Session NQ long setup using the Herman Trading Intelligent Balance Probability Map. The indicator shows an 81% LONG probability, with a liquidity sweep marked near the session low, followed by a bullish iFVG-style entry and strong continuation higher toward the more probable side. Example of combining ICT concepts with probability-based directional bias rather than trading both directions.

ALT 4:5 dark graphic branded Herman Trading. At the top the label "Herman AI Studio" and the headline "The engine behind it. Live." with "Live." in gold. Below, in a glass card, an unaltered screenshot of the Herman AI Studio dashboard: an AI avatar named Herman, Researcher, floats in the centre surrounded by status cards, including AI Agents 3/5 agents watching, 9 open tasks, 6 projects, 60 events today, 10 LinkedIn updates today and Backtesting 17 verified studies. It is the private command centre Herman Trading uses for its trading research, backtesting and content work. www.hermantrading.pro watermark at the bottom.

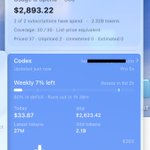
ALT Screenshot of an AI usage tracker panel. The overview card shows usage and spend for the last 30 days: $2,893.22 as a list-price equivalent across 2 subscriptions and 2.32B tokens. Below it, a Codex card for a ChatGPT Pro 5x plan shows weekly 7% left, resets in 6d 2h, today $33.87, 30 days $2,623.42, latest tokens 27M and 30-day tokens 2.1B, with a bar chart of daily usage. A note says the values are estimated from token usage and are not a subscription bill. Top model listed: gpt-6-astra.

ALT Screenshot of the Codex plan usage page. Plan limits are shared across Codex, Work, Workspace Agents and ChatGPT for Excel. The weekly limit bar is almost empty: 7% left, resets in 6d 2h. Recent plan usage shows 7%, and the credits section shows 0 credits remaining.


ALT Herman Trading graphic, dark theme, portrait. Label "Creator team email, 18 Oct 2026" and headline "TradingView's reply. In 6 lines." with the second line in gold. A glass card lists six points in two groups. The transition: 1 Nov is only the deadline to contact TradingView, nothing changes for users on 1 Nov, the final terms will set the new date and steps, and anyone who paid before that date keeps access with no extra cost. The Marketplace: the 100-boost requirement to apply is dropped, and Paid Spaces get more payment options with annual plans coming soon. Footer: public announcement and FAQ expected before the end of October. A summary of TradingView's update for invite-only indicator vendors and their users, with www.hermantrading.pro at the bottom.

ALT Herman Trading graphic, white editorial page, 16:9. The left part, the one visible in the feed, carries the whole hook: the Herman Trading wordmark, an NQ ORB study pill, the label Profit factor 2022 to 2026 and a huge orange 2.24. Under it: 230 trades, $492 each on 1 NQ, positive in 12 of 12 years, then the line Plain ORB on NQ is break-even, 3 filters changed that, and an orange button reading Which three? Swipe. Three orange numbered circles 01, 02 and 03 sit at the right edge with lines running off the picture. The hidden right half answers them: London range 02:00 to 08:00 versus the last 24 days normal, the 08:30 news window quiet under 1x, the setup's own last 10 trades a net loss, plus cards for PF 2.31 in 2015-21, PF 2.24 in 2022-26, $492 per trade and a 62.61% win rate from the NQ opening range breakout study, 2015 to 2026.

ALT Herman Trading summary card, white editorial page, 4:5, headed The whole play, on one card. The setup: OR30, the 09:30 to 09:59 opening range, entry on the first 5 minute close beyond the range either side, stop at the other side, half off at 1R and the rest to the close, no new entries after 12:00. The three filters in orange numbered circles: 01 London range 02:00 to 08:00 versus the last 24 days normal, 02 the 08:30 news window versus the last 24 days quiet under 1x, 03 the setup's own last 10 trades a net loss. Four cards show PF 2.31 in 2015-21, PF 2.24 in 2022-26 in orange, $492 per trade and a 62.61% win rate. A band reads 230 trades in 12 years, 1.6 a month, positive in 12 of 12 years. The footer says 2022-26 was used to confirm it, live data is the first clean test. NQ futures backtest from the Herman Trading Backtesting Centre.

ALT A dark Herman Trading chart card for NQ futures, 4:5. The header reads NQ1! sessions, concept sketch, not real prices, 12 to 16 October, New York time. A drawn candlestick sketch shows one session day: a dashed day high line above the Asia candles, a dashed line at the London low, an amber zone over the whole drop below it and an arrow down that zone labelled ny expansion. Three numbered markers label the sequence: 1 asia high, 2 london low swept, 3 ny low. A table under the chart lists the week: LOW OF DAY is NY on all five days, 5/5, against a 2015 to 2026 baseline of 62.6%; HIGH OF DAY is ASIA, ASIA, ASIA, NY, ASIA, 4/5, against a baseline of 18.4%. The caption bar reads NY ran below the London low a median 1.01x the range, with three boxes, A median 1.01x, B Wed 4.01x, C Fri 4.93x, measuring how far price ran below the London low in multiples of the London range. The footer reads Herman Trading, Follow for Monday's NQ plan and hermantrading.pro.

ALT Wide white Herman Trading graphic in editorial style. The left side holds the hook: an orange pill reading NQ, London range, 2015 to 2026, a huge black 0.93x with a hand drawn orange underline, the line PAST THE LONDON LOW and median run, n 1,480 NQ days. Under it in heavy black type: The other side runs less, with an orange pill reading How much less? Swipe. The HERMAN TRADING wordmark and www.hermantrading.pro sit at the bottom left. The right side is deliberately cut off by the edge of the post: a white card with an orange border holding a labelled concept sketch, not real prices, of candles dropping through a dashed London Low, and the hidden answer. Past the London High: 0.80x, median run, n 1,285 NQ days, the middle 40% of days 0.52x to 1.57x past the Low and 0.43x to 1.25x past the High, the New York range 2.35x the London range, and an orange note to measure the target in London ranges, not in round numbers of points.

ALT White and orange Herman Trading graphic, 4:5. An orange pill top left reads AFTER NY TAKES A LONDON LEVEL, the HERMAN TRADING wordmark sits top right. Heavy black headline: One median. Two different days, with an orange full stop. Sub line: the middle 40% of days, P30 to P70, in London ranges. A white card holds two horizontal range bars on a scale from 0 to 1.5x. Past the London Low: an orange band from 0.52x to 1.57x with a black tick and the label median 0.93x. Past the London High: an orange band from 0.43x to 1.25x with a black tick and the label median 0.80x. A light orange banner reads n 1,480 past the Low, n 1,285 past the High, clean NQ days, 2015 to 2026. Watermark www.hermantrading.pro. The card shows how widely NQ futures expansion beyond a London session level varies from day to day.

ALT Dark Herman Trading hook image, 16:9. The left panel reads Herman Trading, then NQ, New York takes the London level, then the big number 92.8% with the line: of days price trades back to the level before its extreme, n 2,747. Under it This week: 5 of 5, an amber pill reading Three legs. Swipe, and www.hermantrading.pro at the bottom. On the right a real TradingView chart of NQ1! 15 minute bars for Thursday 15 October 2026 runs past the edge of the frame, so at first only its first candles and the dashed amber London 02:00 to 08:00 session box are visible. The hidden part of the image shows the rest of that day with three numbered amber markers: 1 sweep 08:30 at the London low 29,748.50, 2 back inside, 3 low 09:57 at 29,622.50, an amber zone over the move below the level and a red chip reading 126 pts.

ALT Line chart of the equity of an NQ 30-minute opening range breakout with 3 filters, 1 NQ contract after costs, 230 trades from 2015 to October 2026. The curve rises steadily to plus $113,080, profit factor 2.26, 12 of 12 years in profit. Max drawdown $9,943 in June to July 2026. Herman Trading, www.hermantrading.pro.

ALT Four bars showing how 3 filters change the same NQ 30-minute opening range breakout. No filters: PF 1.03, 2,629 trades, $18 a trade. Plus normal London range: PF 1.22, 881 trades. Plus quiet 08:30 candle: PF 1.48, 463 trades. Plus last 10 trades lost: PF 2.26, 230 trades, $492 a trade.

ALT Results card for the NQ 30-minute ORB with 3 filters, 2015-2026, 1 NQ contract: 230 trades, win rate 62.6%, profit factor 2.26, plus $492 per trade, net plus $113,080, max drawdown $9,943, 12 of 12 years in profit, longest losing run 4 trades. PF 2.31 in 2015-2021 and 2.24 in 2022-2026.

ALT White editorial graphic with orange accents from Herman Trading. Top left the Herman Trading wordmark next to an orange pill reading Fridays only, under it the line NQ, 2022-2026, n 87. The heavy black headline reads What London did on those Fridays, with Fridays marked by a hand drawn orange underline. Four numbered rows separated by thin grey rules show what the London session, 02:00 to 08:00 New York time, did with the Asia range on those Fridays: 01, 39.1% in orange, took the Asia high only; 02, 33.3%, took the Asia low only; 03, 26.4%, took both Asia sides; 04, 1.1%, stayed inside the Asia range. The footer reads London 02:00-08:00 ET on Fridays when it opens near the 18:00 daily open, those days end with the low of the day in New York 75.9% of the time. The watermark www.hermantrading.pro sits at the bottom.

ALT Herman Trading graphic, white editorial style with orange accents. An orange pill reads Backtest of the week; the Herman Trading wordmark sits top right. A line reads NQ, 1H, 16:00 NY hour, Friday only. The heavy black headline says Friday's last hour leaves the high alone, with an orange marker underline under alone. An orange bordered card shows 84.9% in huge type, labelled previous hour's high never traded through, beside three values: 2022-2026, 159 candles; distance baseline 68.3%; edge plus 16.6 pp. Three numbered cards under Parameters to copy: 01 the 16:00 NY 1H candle, 02 Friday only, 03 level is the 15:00 hour high. A row headed same play, 2022-2026 lists ES 85.6%, YM 87.3%, RTY 78.7% and GC 53.6%, gold being the market where it breaks. The footer band reads 79.3% across 363 candles since 2015, 11 of 12 years above baseline, event rates, not win rates. NQ futures liquidity sweep backtest from the Herman Trading Backtesting Centre. Watermark www.hermantrading.pro.

ALT Graphic in 4:5 on a light background. Herman Trading wordmark top left, a chip reading Herman AI Studio top right. A small label reads Claude, ChatGPT, Grok. The headline says Claude builds it. I approve it., with the second sentence in gold, and a line below reads The AIs do the work. Nothing ships without my yes. Under it, a white card holds a screenshot of Herman AI Studio: a dark and gold dashboard with floating glass tiles around an AI avatar, showing AI agents 3/5, Typefully 14 drafts waiting, Backtesting 12 verified studies with the ES Candle Path Study v2 for 2015 to 2026, Post ideas 33, Socials 18,022 followers and a caption about 12 verified studies. Three chips below read 12 verified studies, 33 post ideas and 18 posts in the pipeline. The private AI command centre behind Herman Trading, the trading education and indicator brand for futures traders. www.hermantrading.pro at the bottom.

ALT Dark Herman Trading chart card, 4:5. Header: NQ, sessions, concept sketch, not real prices, and EXPANSION 62.2% OF DAYS in amber on the right. The pane holds a drawn candlestick sketch, not real market data: a London range builds under a dashed amber level labelled london high and above a second dashed level, then breaks below that lower level. Three numbered amber markers walk through the sequence: 1 london low, the level below the range, 2 low taken, the candle that sweeps through it, 3 closes beyond, the last candle inside an amber zone that marks the expansion below the level. Caption bar: 59.4% to 65.9% Mon to Fri in amber, then the question So what decides the day, with three answers, 1 The level, 2 The sweep, 3 The close. Footer: Herman Trading, Reply 1, 2 or 3, hermantrading.pro. For NQ and MNQ futures traders using ICT and Smart Money Concepts: a New York expansion takes a London session level and closes beyond it, and the weekday barely changes how often that happens.