
Author of award winning newsletter and how to book regarding market timing analysis.
Lincoln, Nebraska
Joined April 2009
- Tweets2.2K
- Following268
- Followers7.3K
- Likes19
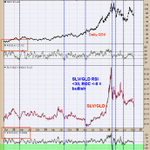


The middle window is the SLV/GLD ratio; bottom window is the “rate of change” (ROC) for the ratio and window above $SLV/$GLD is RSI for this ratio. Today Silver plunged compared to the price of gold and pushed the RSI below 30 and the ROC to near -8 (-7.80). This chart goes back to October 2022 (4 years). We noted the times with dotted blue lines when the RSI fell below 30 and the ROC reached near -8. This setup happened seven times going back four years and in all cases the GDX was at or near a worthwhile low. It’s common near important lows where an unusual event occurs and the silver plunging compared to the price of gold is the unusual event this go around.

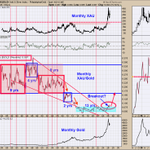
Here is the bigger picture for the $XAU ($GDX) that may be forming; you seen this chart before and has been updated. The middle window is the monthly XAU/Gold ratio and top window is the monthly XAU. This chart goes back to 1982 (as far back as I could go). We shaded in blue where the monthly XAU/Gold ratio has been trading which is from .05 to .08; and has been in this trading range for 13 years (which is unusual long for this ratio). The monthly XAU/GOLD ratio has been above the .08 level for the last month and maybe breaking out (which is due time). If a break out is occurring (likely) the next upside target is the .16 area (noted with red arrow). If you do the math; to get to .16 on the ratio than XAU would need to go to 722 (double from current levels) and that is without gold moving from current level; but gold will move higher pushing XAU even higher.

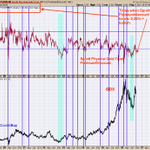
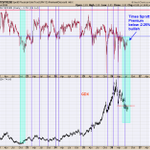
The top window is the premium/discount for the Sprott gold trust fund; the bottom window is the daily GDX. We noted with blue lines and shaded green areas when the discount for the Sprott gold trust fund reached minus 2.25 or lower. This chart goes back to mid 2019. In all cases when the discount reached minus 2.25 or lower, GDX was at least at a short term low if not a major low. Yesterday the discount closed at -2.82; suggests the consolidation that began back in mid August is near ending and the next rally phase is about to begin

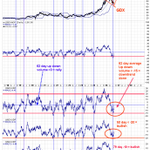
The bottom window is the 50 day average of the up down volume for $GDX. Reading above “0” show that GDX is in an uptrend (shaded in blue) and readings below “0” and down trend (shaded in pink). Current reading on this indicator is +6.48 showing that GDX is in an uptrend. There is another important aspect on this chart. When this indicator is coming off a low, its ideal for it to reach +20 or higher (showing initiation of an uptrend); suggesting a strong uptrend is beginning. We noted past examples of the 50 day average of the up down volume reaching +20 coming off a low with blue dotted lines; the last three times the rally lasted form 8 months to 1 year. Like to see the current rally continue and push the 50 day average of the up down volume to reach +20 or higher.

The chart above goes back to late 2017. The bottom window is the 79 day average of the up down volume for GDX; next higher window is the 50 day average for the up down volume and next higher window is the 62 day average for the up down volume. Noted with blue lines the times when all three moving averages reached their oversold levels and than turned up. The turn up dated started July 10 to July 24; the low in GDX came on July 17. Once these moving averages of the up down volumes reached their oversold levels and turned up the corresponding rallies in GDX lasted at least 6 months. Lets say the rally in GDX started on August 1, the current rally should last into February 2027 and a minimum. Minimum upside $GDX rally should reach 117.00; but could go much higher.

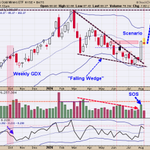
Above is the weekly $GDX . The pattern formed since the March high appears to have been a “Falling Wedge” pattern. This pattern forms when the boundary lines connecting the highs and lows converge into an apex. As the market merges into the apex, the volume gradually declines; and that is the pattern forming on the weekly GDX. To confirm the “Falling Wedge” pattern a “Sign of Strength” (SOS) appears on a break of the down sloping trend line; which is shown on the weekly GDX timeframe above. Minimum upside target on a “Falling Wedge” is where the pattern began; in the GDX case above would be the March high near 117.00 range.

The month of July ends this Friday. Above is the monthly chart for $GDX. Volume goes in the direction of strength. In June (labeled on the chart above) GDX broke below the March low on lighter volume suggesting a false break to the downside. The month of July tested the low of June and with two trading days to go will have lighter volume than the June volume. To get a bullish signal the close of July will need to close above the June low. The June low was 73.63 and had volume of 554 million shares. The July close would need to be 73.63 or higher and have volume of 499 million shares or less. Current monthly volume stands at 350 million shares and would need to trade over 145 million shares in the next two days to void this bullish setup. The average daily volume in July is 23 million shares so its unlikely GDX will have volume of 145 million in the next two days. A close at or above 73.63 on Friday will most likely be bullish.”

We have shown this chart in the past which is the Sprott Physical gold trust premium/discount (top window) and GDX bottom window. When the Sprott Physical Gold trust sells at 2.25% or lower discount to the net asset value (NAV) than GDX is near a low. We noted with blue lines and shaded green when the discount was 2.25% or less. Currently the discount has remained below 2.25% for over two months (shaded in green) and the last time the discount remained below 2.25% for that length of time came in late 2022 (shaded in green) and that low marked the beginning for a $GDX rally that lasted in January 2026. According to the $Sprott Physical gold trust discount of 2.25% and lower suggests GDX is at a low. The discount of 2.25% has lasted over two months just like the low back in late 2022; which could mean a multi year rally in GDX is possible.

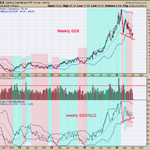
There is positive divergence present. Looking form March to July of 2026, notice that the weekly $GDX/GLD ratio has made higher lows while the $GDX has made lower lows (red lines) suggesting a bullish outcome is likely. The GDX/GLD ratio leads GDX. When the weekly ratio is above its mid Bollinger band it produces an uptrend in GDX (shaded in green). When the weekly ratio is below its mid Bollinger band it produces a downtrend in GDX (shaded in pink). Though currently the weekly GDX/GLD ratio is still below its mid Bollinger band a bullish divergence is present. Seasonality has turned bullish into August and we are looking for signs for the uptrend to begin near current levels.

Tim Ord retweeted

Buffett Indicator shows us we are at the secular peak of overpriced growth assets vs undervalued real assets. Last time the indicator peaked was 1970 and 2000. Both times Gold and real assets went on a 10 year run.

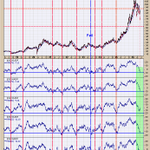
The bottom window is the 62 day average of the advance/decline; next higher window is the 62 day of the up down volume; next higher window is the 50 day average for the up down volume; next higher window is the 79 day average for the advance/decline and next higher window is the 79 day average for the up down volume. We note with red lines when all moving averages reached their over sold levels and in turn marked lows in the GDX. These are momentum indicators for the advance/decline and up down volume for GDX and when these indicators reach their lower blue lines it suggests exhaustion to the downside for GDX. Exhaustion appears near lows in $GDX.

The top window is the daily Gold chart; bottom window is the daily GDX and middle window is the physical premium for gold in the Sprott gold trust. We noted the times when the premium for the Sprott gold trust falls below -2.25% (buying fund at a 2.25% discount compared to price of gold). This is a sentiment indicator. Current discount is 3.12%. This chart goes back to mid 2019. In all cases the $GDX was near a low. The current discount below -2.25 has been going on since April and the last time the discount stayed below -2.25 for over two month was back in late 2022 – early 2023 (noted is shaded green). Sentiment is bullish suggesting a low is not far off.

The bottom window is the GDX advance/decline with an 18 day average; next higher window is the GDX up down volume with an 18 day average, top window is the daily GDX. We noted with red lines when both indicators reach below -40 showing panic in the advance/decline and up down volume. The minus 40 levels in both indicators show exhaustion to the downside and in turn where bottoms form. We shaded in light blue on the daily GDX when these exhaustion readings on these indicators occurred. What may transpire in the coming days are for both indicators reach -40 levels and setting up the next rally phase for $GDX. Both indicators are coming in near the -12 range right now and near -30 points away from our target range.

The bottom window is the monthly GDX/GLD ratio and next higher window is the monthly $GDX. In bull market the GDX/GLD ratio rises and in bear market this ratio declines. The GDX/GLD ratio has been in a sideways trading range going back to 2014 (12 years) and is due for a breakout. We circled in pink where we are now. This ratio has traded above the two previous highs of 2020 and 2016 which came in near .21 levels. This ratio has been hovering near .22 since late 2025 and not backing away form the breakout area. If a market holds near the breakout area; it implies the market is eating through the supply and in turn the resistance level. It appears GDX/GLD may be breakout out of the .22 level; next upside resistance is the .40 range. If the .40 range is achieved, than GDX would near double form current prices. We are keeping our eye on the bigger timeframes as a large rally in GDX is not far off.
