

Empowering Traders, Analysts, and Portfolio Managers to discover unique market opportunities with powerful software and valuable education.
Brisbane, Australia
Joined May 2009
- Tweets4.7K
- Following460
- Followers10.3K
- Likes4.1K







Optuma retweeted
The quiet years are over: Optuma is now on the web. optuma.com/blog/quiet-years-…

Optuma retweeted
Really exciting week at Optuma as we are finally opening up access to the new web-based platform. This was a complete rebuild of Optuma, bringing AI into the platform from the start, designing a visual node-based system for building backtests and scans, and creating a model builder that runs on a proprietary quantitative engine. You can read more about it here, and if you want to get hands-on with the new platform, just let us know.
optuma.com/blog/optuma-web-a…

Optuma retweeted
I’ve had a few people ask about the candle colors on my charts.
They are part of my Gann Swing Rank Color System.
Instead of staring at dozens of indicators, I combine just two things:
• Trend
• Swing
That instantly tells me whether I’m looking to buy strength, buy a pullback, build a watchlist, or simply stay away.
The whole point is to make decision-making faster and remove as much subjectivity as possible.
The best systems simplify the decision. They don’t complicate it.
@Optuma

Optuma retweeted

Investing Update: The June Swoon?
Charts from @charliebilello @MikeZaccardi @granthawkridge @DualityResearch @TheChartReport @Optuma @VandaTrack @i3_invest @KevRGordon @dailychartbook @SergeyCYW @HostileCharts @KobeissiLetter @RyanDetrick @AlmanacTrader @eWhispers @Ritholtz @mauraball
spilledcoffee.substack.com/p…

Optuma retweeted

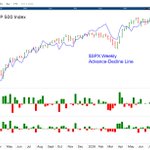
Today's Chart of the Day was shared by @Optuma
The bulls keep stacking evidence, with the S&P 500 Advance / Decline Line making new record highs.
Get the full breakdown in today's report plus more great charts. ⬇️
thechartreport.com/06-15-26


Optuma retweeted

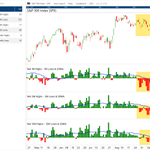
In the last almost 30 years, the number of times there's been at least 7% of stocks making a 52-week low when the S&P 500 was at a 52-week high: Two


Optuma retweeted
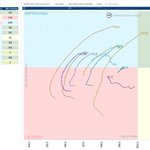
Weekly RRG rotation snapshot - structure > noise. ✅
🔵 CYCLICALS - early leadership, now cooling
🔥 $XLE (Energy) → still leading but momentum rolling over
✅ $XLB (Materials) → fading inside leading, losing strength
⚠️ $XLRE (Real Estate) → improving but not leadership
❌ $XLY (Discretionary) → weak, lagging
📌 Conclusion:
Cyclicals led the bounce. Now they’re cooling, not breaking.
🟣 GROWTH — rotation starting, not confirmed
✅ $XLI (Industrials) → clear leader, strong RS + momentum
⚠️ $XLC (Comm Services) → improving, early rotation
⚠️ $XLK (Tech) → lagging but trying to hook up
❌ $XLF (Financials) → weak, late rotation
📌 Conclusion:
Growth is rotating, but not broad leadership yet.
Industrials still leading this phase.
🟢 DEFENSIVES — holding, not panic
⚠️ $XLU (Utilities) → still leading but flattening
⚠️ $XLP (Staples) → rolling inside leading
❌ $XLV (Healthcare) → weak participation
📌 Conclusion:
No rush into safety. Defensives not confirming fear.
🧠 BIG PICTURE (Weekly RRG)
• Cyclicals → led, now cooling
• Industrials → leadership intact
• Tech + Comm → attempting rotation
• Defensives → not risk-off behavior
📌 Final take:
This is rotation, not breakdown.
Market already reset ~10% and held higher timeframe structure.
Leadership is shifting, not collapsing.
If growth joins → expansion.
If not → pullback, then higher.
Weekly rotation tells the truth. ✅
$SPX $SPY $QQQ @Optuma

Optuma retweeted
OPTEX just fired.
This isn’t random. Look at the rhythm.
November: –5.5% → V bounce
December: –3.4% → continuation
January: –3.1% → higher high
February: –3.2% → structure holds
Every dip was controlled. Rotational. Bought.
Now March: –5.5%
That’s the shift.
We’re no longer in a 3% pullback environment.
This is expansion. Acceleration.
Same category as November - not noise.
Optex = an extreme/mean reversion tool.
It flags when price is stretched too far from balance and likely nearing exhaustion.
Now you have that signal firing into a –5.5% move.
That’s confluence.
6550 is the level.
Hold → bounce + base
Break → continuation lower
Not calling bottom — this is where reactions happen.
Let price confirm.
$SPX $SPY $QQQ @Optuma

Optuma retweeted

The S&P 500 is <0.5% above its 200-day moving average after 211 days above it.
What happens when runs this long finally break?
Find out here: dropbox.com/scl/fi/julpxt5q8…
redcedarresearch.com

Optuma retweeted

Pitchforks identify the vector of price moves in price and time like no other technical tool. To learn about the application of Andrews Pitchfork go to the three part Pitchfork series at themarketscompass.com


Optuma retweeted
$SPX just triggered a fresh Optex Bands exhaustion reading. The last time this signal fired was at the April low.
The daily swing is still DOWN, but this entire flush is happening inside structure, not breaking it.
Optex only fires when momentum reaches a true extreme, and this is one of those zones.
Optex Bands is a proprietary tool from @Optuma and when it fires, I pay attention.
$SPY $QQQ

Optuma retweeted
$SPX Quarterly Structure (from the Credit Crisis Low)
• 2009–2015: +220% in 25 quarters → 15% quarterly resets.
• 2016–2022: +166% in 24 quarters → 27% cyclical resets
• 2022–Now: +98% in 12 quarters — mid-cycle advance
🌀 Rhythm & geometry intact.
📏 200% Fib projection (1810 → 4818 → 3491) = 9500 target.
Every cycle run ~6 yrs before reset — next top could align with 2027–2028.
Started at the Credit Crisis low (666.79) — this is not a trader’s chart; it’s an investor’s map.
$SPY $QQQ @Optuma

Optuma retweeted
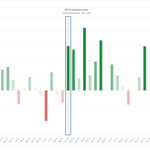
📊 $SPX Seasonality Alert 🚨
Today is Sept 19th. History shows the last week of September is the weakest stretch of the year.
From Sept 24–30, markets average -0.40% to -0.60% per day 📉
Even with the swing still UP, seasonality warns of selling pressure into month-end.
🗓️ Quarter-end flows + weak seasonality = caution zone.
Trade what you see, not what you think. ✅
Have a great weekend. Thank you.
$SPY $QQQ @Optuma
