

Finally, kick-ass charts to build confidence in your trades. SPY / QQQ / BTC nightly. Chart requests in discord. |West Point '98| https://xitter.cf/t.co/qGxEJnOiUQ
Joined March 2009
- Tweets17.3K
- Following629
- Followers6.1K
- Likes25.4K

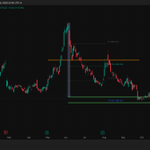
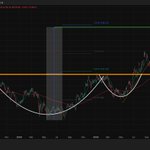



Specifically, it's a forward guidance earnings bubble from the semi's and memory stocks. The moment you hear the first hyperscaler state they are going to scale back on buying memory/chip CAPEX, the top is already in.
But, if the hyperscalers double down and increase CAPEX for memory/chips, then we go higher.


Forward P/E is calculated using forward earnings .....which are forecasts, not actuals. These high earnings forecasts are driven by hyperscalers buying GPUs and memory.
So, semiconductor and memory forecasts from hyperscaler revenue are holding up the entire market. That's it. It's that simple. It's a forward guidance earnings bubble.
The moment you hear a hyperscaler state that they will be scaling back the P/E on this chart will BALLOON
Keep your eye on the exit.


Options Johnny retweeted

BREAKING: The 15 largest S&P 500 stocks now account for a record 46.7% of the index’s market value.
By comparison, during the 2000 Dot-Com Bubble, the 15 largest stocks accounted for 27.2% of the S&P 500.
The remaining 485 stocks represent just 53.3% of the S&P 500’s market cap.
This comes as Nvidia, $NVDA, Apple, $AAPL, Alphabet, $GOOGL, and Microsoft, $MSFT, account for 7.5%, 7.1%, 5.9%, and 5.6%, respectively, or 26.1% combined.
This means just 4 stocks account for more than the next 11 combined.
Furthermore, the combined market cap of the 5 largest stocks now equals that of the bottom 434 stocks in the index, the largest gap on record.
Market concentration is at historic extremes.

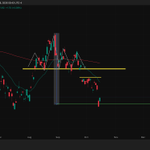
$FSLR: Inverse cup and handle break down and measured move price target attainment.



Options Johnny retweeted

Good Luck with that "Strong Economy".
There are NO signs of it. On the Contrary!
It is the weakest it has ever been outside severe recessions. And it speaks volumes about how bad it is going to get.
NAHB leads Unemployment.
It will be UGLY.
(...and please make note of all the "economists" and "macro experts" who do not see it)

Simple, elegant solution.
All you need are candles and an options chain.
youtube.com/shorts/qIL2Z3ffy…


