

Trader in Helsinki 🇫🇮 | US stocks & indices | Daily charts | Wave counts + momentum setups | The level that kills the idea is in the chart | Not advice
Helsinki, Finland
Joined October 2018
- Tweets1.6K
- Following77
- Followers26.8K
- Likes485




$SPCX did the retest. After the first target at $172 it fell back into the $147-$158 base I posted in October, closed $147.79 on earnings day, and the report sent it to $161 overnight.
Back above the base is what I wanted to see. $172.40 is the next line, then the IPO high at $225.64. The 0.5 at $140.62 is where this map fails.

Memory’s decline has a floor on my chart: $SNDK’s $1,346-$1,193 zone and $MU’s $830-$760 box. The top was a 4, not the end.
xitter.cf/ItsStopFirst/status/21…

Monday I got told in a few threads that $MU doesn’t dip. $876 overnight, 20% off the top. Dips don’t ask for permission.
The y leg is running and the box got bigger: the 0.382-0.5 of the whole wave up sits at $799-$658, with the 200-day near $752 inside it. That’s where I expect 4 to finish and 5 to start.
Everyone who was bullish at $1,100 should like it more down here. Most won’t.

Green so far: NQ +0.5% overnight, $QQQ $723, eleven dollars above my box. Tonight’s $META and $TSLA prints decide the color.
xitter.cf/ItsStopFirst/status/21…
Four charts for the week. Boxes are where I expect the dips to end, each with the price that proves me wrong.
$QQQ: 2 of (iii) inside the $700-$712 box, Friday closed $709.80. A week or two of chop here, then 3 toward $800. Wrong below $660.
$TSLA: (i) topped at $388, (ii) is heading for the $343-$332 box, the 0.5-0.618 of the run from the July low, and earnings Wednesday land inside it. Wrong below $297.
$META: ④ is a W-X-Y and the (Y) leg is dropping into the $680-$700 box. Earnings Wednesday, then ⑤ back at the $797 high. Wrong below $680.
$NVDA: (i) ran from $190 to $243, (ii) is already inside the $217-$210 box at $214, with the 200-day near $205 underneath. Wrong below $190.
Four boxes, four lines where I’m wrong. That’s the whole plan for the week.


Last week was a 2, the kind that ends where everyone gives up. $QQQ stopped in the $700-$712 box and the bounce is the first look at 3.
xitter.cf/ItsStopFirst/status/21…
Four charts for the week. Boxes are where I expect the dips to end, each with the price that proves me wrong.
$QQQ: 2 of (iii) inside the $700-$712 box, Friday closed $709.80. A week or two of chop here, then 3 toward $800. Wrong below $660.
$TSLA: (i) topped at $388, (ii) is heading for the $343-$332 box, the 0.5-0.618 of the run from the July low, and earnings Wednesday land inside it. Wrong below $297.
$META: ④ is a W-X-Y and the (Y) leg is dropping into the $680-$700 box. Earnings Wednesday, then ⑤ back at the $797 high. Wrong below $680.
$NVDA: (i) ran from $190 to $243, (ii) is already inside the $217-$210 box at $214, with the 200-day near $205 underneath. Wrong below $190.
Four boxes, four lines where I’m wrong. That’s the whole plan for the week.
The handle was the $147-$158 base and the earnings dip was its retest. $172.40 is the next line for me, then the IPO high at $225.64.
xitter.cf/ItsStopFirst/status/21…
Lots of launch headlines on here this weekend, and $200 and $300 targets from the banks. What got my attention is the base.
$SPCX spent five weeks going sideways between 147 and 158, right on top of its IPO-day low, with the 50-day rising underneath. Friday it closed above the top of that range on the launch news.
Next levels on my chart are 172 and then the IPO high at 225. Back inside the base and the breakout didn't work.

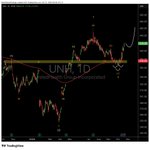
$UNH is one of the few charts that already finished its 2. The run from $253 to $459 was 1 on my chart, five waves, and 2 came back as an (a)-(b)-(c) into the $372-$380 shelf, the old breakout level with the 200-day sitting on it. It bottomed at $363 on October 1st and has run 15% since.
Healthcare plans rank 4th of 144 industries on relative strength, which is where I want a 3 to come from. A dip toward $400 would be a normal pause on the way.
Below $363 I’m wrong.

Revenue beat with $SPCX at $147, the top of the $147-$158 base it left in October after tagging $172. This report is the retest.
xitter.cf/ItsStopFirst/status/21…
Lots of launch headlines on here this weekend, and $200 and $300 targets from the banks. What got my attention is the base.
$SPCX spent five weeks going sideways between 147 and 158, right on top of its IPO-day low, with the 50-day rising underneath. Friday it closed above the top of that range on the launch news.
Next levels on my chart are 172 and then the IPO high at 225. Back inside the base and the breakout didn't work.
Stop First 🛑 retweeted
Four charts for the week. Boxes are where I expect the dips to end, each with the price that proves me wrong.
$QQQ: 2 of (iii) inside the $700-$712 box, Friday closed $709.80. A week or two of chop here, then 3 toward $800. Wrong below $660.
$TSLA: (i) topped at $388, (ii) is heading for the $343-$332 box, the 0.5-0.618 of the run from the July low, and earnings Wednesday land inside it. Wrong below $297.
$META: ④ is a W-X-Y and the (Y) leg is dropping into the $680-$700 box. Earnings Wednesday, then ⑤ back at the $797 high. Wrong below $680.
$NVDA: (i) ran from $190 to $243, (ii) is already inside the $217-$210 box at $214, with the 200-day near $205 underneath. Wrong below $190.
Four boxes, four lines where I’m wrong. That’s the whole plan for the week.
The debt is in every thread, the price has told the same story three times: $58-$65 in November, July and now. Below $58 the debt wins.
xitter.cf/ItsStopFirst/status/21…
$CRWV is back at $64, the third visit to the $58-$65 box in a year, and it’s the one I’ve been waiting for.
On my chart the whole slide from last June’s $187 top is (2), a W-X-Y. W bottomed in this box last November, the first leg of Y bottomed here in July, and this drop is the last leg, (y) of Y. Three touches of the same shelf, each one on worse headlines, with 18% of the float short into it.

Breakeven $347 sits right under the line on my $GOOG chart: a close above $350 and 3 is on, triangle done at $333. Same number, other tool.
xitter.cf/ItsStopFirst/status/21…
$GOOG finished the triangle. (e) tagged the lower line and the 200-day near $333 last week, and that’s 2 on my chart, a W-X-Y that took five months. $340 now.
Same line as two weeks ago: a close above $350 and 3 is on, with the chart projecting toward $500 where 3 equals 1. Earnings on the 28th land inside that decision.
Under $325 I’m wrong.

The discount was the $700-$712 box, the 2 of (iii) on my chart, and Friday closed inside it. $719 now, $745 is the first marker.
xitter.cf/ItsStopFirst/status/21…
Four charts for the week. Boxes are where I expect the dips to end, each with the price that proves me wrong.
$QQQ: 2 of (iii) inside the $700-$712 box, Friday closed $709.80. A week or two of chop here, then 3 toward $800. Wrong below $660.
$TSLA: (i) topped at $388, (ii) is heading for the $343-$332 box, the 0.5-0.618 of the run from the July low, and earnings Wednesday land inside it. Wrong below $297.
$META: ④ is a W-X-Y and the (Y) leg is dropping into the $680-$700 box. Earnings Wednesday, then ⑤ back at the $797 high. Wrong below $680.
$NVDA: (i) ran from $190 to $243, (ii) is already inside the $217-$210 box at $214, with the 200-day near $205 underneath. Wrong below $190.
Four boxes, four lines where I’m wrong. That’s the whole plan for the week.
The gap fill landed in my $700-$712 box, 2 of (iii) for me, and $719 now. $745 is the first marker up, $660 is where I’m wrong.
xitter.cf/ItsStopFirst/status/21…
Four charts for the week. Boxes are where I expect the dips to end, each with the price that proves me wrong.
$QQQ: 2 of (iii) inside the $700-$712 box, Friday closed $709.80. A week or two of chop here, then 3 toward $800. Wrong below $660.
$TSLA: (i) topped at $388, (ii) is heading for the $343-$332 box, the 0.5-0.618 of the run from the July low, and earnings Wednesday land inside it. Wrong below $297.
$META: ④ is a W-X-Y and the (Y) leg is dropping into the $680-$700 box. Earnings Wednesday, then ⑤ back at the $797 high. Wrong below $680.
$NVDA: (i) ran from $190 to $243, (ii) is already inside the $217-$210 box at $214, with the 200-day near $205 underneath. Wrong below $190.
Four boxes, four lines where I’m wrong. That’s the whole plan for the week.
YouTube share grows and the chart is waiting on one number: a close above $350 and 3 is on for me. $338 now, triangle done at $333.
xitter.cf/ItsStopFirst/status/21…
$GOOG finished the triangle. (e) tagged the lower line and the 200-day near $333 last week, and that’s 2 on my chart, a W-X-Y that took five months. $340 now.
Same line as two weeks ago: a close above $350 and 3 is on, with the chart projecting toward $500 where 3 equals 1. Earnings on the 28th land inside that decision.
Under $325 I’m wrong.
Goldman says $106, HSBC says $39, my chart says the $58-$65 box decides first. Below $58 HSBC gets the next word.
xitter.cf/ItsStopFirst/status/21…
$CRWV is back at $64, the third visit to the $58-$65 box in a year, and it’s the one I’ve been waiting for.
On my chart the whole slide from last June’s $187 top is (2), a W-X-Y. W bottomed in this box last November, the first leg of Y bottomed here in July, and this drop is the last leg, (y) of Y. Three touches of the same shelf, each one on worse headlines, with 18% of the float short into it.
Why I watch the crowd and not the news.
A price is just people agreeing. Millions of them, swinging between hope and fear, and they do it in the same order every time: nobody believes the first leg up, everyone sees the third, confidence peaks at the top, then the bounce traps the late buyers and the fall takes the rest.
That order is the whole reason Elliott waves work.
#elliott #elliottwave
Red by 0.5%, and $QQQ is still three dollars above my $700-$712 box. A red day above the box is a 2 catching its breath.
xitter.cf/ItsStopFirst/status/21…
Four charts for the week. Boxes are where I expect the dips to end, each with the price that proves me wrong.
$QQQ: 2 of (iii) inside the $700-$712 box, Friday closed $709.80. A week or two of chop here, then 3 toward $800. Wrong below $660.
$TSLA: (i) topped at $388, (ii) is heading for the $343-$332 box, the 0.5-0.618 of the run from the July low, and earnings Wednesday land inside it. Wrong below $297.
$META: ④ is a W-X-Y and the (Y) leg is dropping into the $680-$700 box. Earnings Wednesday, then ⑤ back at the $797 high. Wrong below $680.
$NVDA: (i) ran from $190 to $243, (ii) is already inside the $217-$210 box at $214, with the 200-day near $205 underneath. Wrong below $190.
Four boxes, four lines where I’m wrong. That’s the whole plan for the week.