

Trader in Helsinki 🇫🇮 | US stocks & indices | Daily charts | Wave counts + momentum setups | The level that kills the idea is in the chart | Not advice
Helsinki, Finland
Joined October 2018
- Tweets1.6K
- Following77
- Followers26.8K
- Likes485




Pinned Tweet
Four charts for the week. Boxes are where I expect the dips to end, each with the price that proves me wrong.
$QQQ: 2 of (iii) inside the $700-$712 box, Friday closed $709.80. A week or two of chop here, then 3 toward $800. Wrong below $660.
$TSLA: (i) topped at $388, (ii) is heading for the $343-$332 box, the 0.5-0.618 of the run from the July low, and earnings Wednesday land inside it. Wrong below $297.
$META: ④ is a W-X-Y and the (Y) leg is dropping into the $680-$700 box. Earnings Wednesday, then ⑤ back at the $797 high. Wrong below $680.
$NVDA: (i) ran from $190 to $243, (ii) is already inside the $217-$210 box at $214, with the 200-day near $205 underneath. Wrong below $190.
Four boxes, four lines where I’m wrong. That’s the whole plan for the week.


$SPCX did the retest. After the first target at $172 it fell back into the $147-$158 base I posted in October, closed $147.79 on earnings day, and the report sent it to $161 overnight.
Back above the base is what I wanted to see. $172.40 is the next line, then the IPO high at $225.64. The 0.5 at $140.62 is where this map fails.

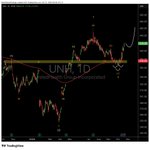
$UNH is one of the few charts that already finished its 2. The run from $253 to $459 was 1 on my chart, five waves, and 2 came back as an (a)-(b)-(c) into the $372-$380 shelf, the old breakout level with the 200-day sitting on it. It bottomed at $363 on October 1st and has run 15% since.
Healthcare plans rank 4th of 144 industries on relative strength, which is where I want a 3 to come from. A dip toward $400 would be a normal pause on the way.
Below $363 I’m wrong.

Stop First 🛑 retweeted
Four charts for the week. Boxes are where I expect the dips to end, each with the price that proves me wrong.
$QQQ: 2 of (iii) inside the $700-$712 box, Friday closed $709.80. A week or two of chop here, then 3 toward $800. Wrong below $660.
$TSLA: (i) topped at $388, (ii) is heading for the $343-$332 box, the 0.5-0.618 of the run from the July low, and earnings Wednesday land inside it. Wrong below $297.
$META: ④ is a W-X-Y and the (Y) leg is dropping into the $680-$700 box. Earnings Wednesday, then ⑤ back at the $797 high. Wrong below $680.
$NVDA: (i) ran from $190 to $243, (ii) is already inside the $217-$210 box at $214, with the 200-day near $205 underneath. Wrong below $190.
Four boxes, four lines where I’m wrong. That’s the whole plan for the week.
Why I watch the crowd and not the news.
A price is just people agreeing. Millions of them, swinging between hope and fear, and they do it in the same order every time: nobody believes the first leg up, everyone sees the third, confidence peaks at the top, then the bounce traps the late buyers and the fall takes the rest.
That order is the whole reason Elliott waves work.
#elliott #elliottwave
$GOOG finished the triangle. (e) tagged the lower line and the 200-day near $333 last week, and that’s 2 on my chart, a W-X-Y that took five months. $340 now.
Same line as two weeks ago: a close above $350 and 3 is on, with the chart projecting toward $500 where 3 equals 1. Earnings on the 28th land inside that decision.
Under $325 I’m wrong.


$GOOG is leaning on the line I posted two weeks ago, $352 today and green while chips bleed.
On my count wave 2 ended as a triangle, (a) through (e), right on the 200-day. A strong close above $350 could light the fuse for wave 3. I’ve been waiting on this one longer than I’d like to admit.
Back under $325 and I’m wrong.

$ASML tagged the lower triangle line on Thursday, $1,594, and closed the week at $1,641, inside the $1,689-$1,497 box. That’s the (e) on my chart, the fifth and last leg of the triangle for 4.
Triangles end quietly, which is why nobody is looking at this one. 5 is the leg back above $2,000, and the first sign it has started is a daily close above the (d) high near $1,874.
Under $1,497 I’m wrong on the 4.


$MU bounced 3% yesterday to $905, and the y leg of 4 is still running on my chart. The box hasn’t changed, $830-$760 with the 200-day at $757 inside it, and the 0.5 at $658 is the deeper option if the first one doesn’t stop it.
4 is a w-x-y: w into $738 in July, x back to $1,109 in September, y now. RS 99 even after a 28% drop, which is why I’m patient with it. The yellow zone is where 5 should start, and 5 is the leg back above $1,255.
Below $658 I’d rethink the 4.

Monday I got told in a few threads that $MU doesn’t dip. $876 overnight, 20% off the top. Dips don’t ask for permission.
The y leg is running and the box got bigger: the 0.382-0.5 of the whole wave up sits at $799-$658, with the 200-day near $752 inside it. That’s where I expect 4 to finish and 5 to start.
Everyone who was bullish at $1,100 should like it more down here. Most won’t.

$AMD is already inside the box. The run from $440 to $658 was five clean waves, i on my chart, and this 20% pullback is ii, now $529 between the 0.5 at $550 and the 0.618 at $524.
Second waves in a stock with RS 98 are the ones I want on my screen. iii is next, and the chart has room toward $760. Earnings on November 3rd sit just outside this window.

$CRWV is back at $64, the third visit to the $58-$65 box in a year, and it’s the one I’ve been waiting for.
On my chart the whole slide from last June’s $187 top is (2), a W-X-Y. W bottomed in this box last November, the first leg of Y bottomed here in July, and this drop is the last leg, (y) of Y. Three touches of the same shelf, each one on worse headlines, with 18% of the float short into it.

$INTC closed $89.85 Friday, 37% off the June high and 3% above the 200-day at $87, the first stop I had for this leg.
On my chart the whole drop from $140 is 2, a w-x-y, and this is the y. The $70-$81 box where the August low sits is where I expect it to end, and earnings on the 29th give it a deadline. Wave 3 starts from there, not from here.
Below $40.64 the count is off.

$MSFT turned at $551 on Tuesday, short of the $571-$627 box, and that’s fine, five waves are five waves. 1 is done on my chart and 2 has started, $529 Friday.
The $480s down to the 200-day near $457 is where I’d expect 2 to end, and earnings on the 28th land right inside that pullback. Same map as last week, just one step further along.
Under $349 I’m wrong.

Nobody talks about $JPM this week, so I will. (iv) ended as a w-x-y at $324 on October 1st, right in the $322-$328 box with the 200-day inside it, and Friday it closed $339.72, green on a red day.
On my chart (iv) is done, and (v) is the leg that takes it back above the August high at $365. Banks already reported, so nothing in the way until January.
Under $324 I’m wrong.

$QQQ closed $709.80 Friday, inside the $700-$712 box, 0.5 to 0.618 of the whole run from the late-July low. Fear & Greed printed 18 the same day.
On my chart the late-July low ended (ii), the run to $762 was 1 of (iii), and this drop is 2. I don’t expect a V here, more like a week or two of chop inside the box while everyone gives up on it, then 3 of (iii) toward $800 into year-end.
Below the late-July low near $660 I’m wrong.

CPI came in hot where it matters. Headline 3.7% as expected, core 0.3% on the month for the second time, 2.6% on the year. Gasoline alone was up 9% in September.
Futures gave back the morning on the print: Nasdaq about half a percent, small caps nearly one. Chips still heavy, the mega caps holding up better, the same split as yesterday. Not a panic, a repricing.
$QQQ sits under the $745 box. Reclaim it and ② is done, lose it and ② has room to $700-$710 first. Either way I’m looking up from here, and $700 is where I’d stop looking.

$SNDK did exactly what the zone was for. $1,276 yesterday, inside the $1,346-$1,193 box, then a close at $1,395 back above the 0.618. That was the (ii) on my chart, and it hurt right up until it didn’t.
Next is (iii), and the first thing in its way is the falling line from the June top, near $1,780 in a couple of weeks. Earnings on the 29th sit in that window.
Under $1,000 I’m wrong. Zones are for days like yesterday.

$SNDK got hit hardest by the CXMT headline yesterday, -12%, and it hurt to watch. On my chart it’s a (ii) I’d actually welcome.
Wave 2 ended near $1,000 in August, (i) of 3 ran to $1,900 as a leading diagonal, and this drop is (ii). The $1,346-$1,193 zone, 0.618 to 0.786 with the 200-day sitting inside it, is where I’d expect it to stop.
Then (iii) has to clear the falling line from the June top.
Under $1,000 I’m wrong.

$KOSPI closed 5,554 today, down 7.6%, the 10th circuit breaker of the year. From the June top that’s 40% in 77 sessions, faster than 1997 and 2008 managed.
This is the third wave of (c) from Monday’s chart, moving the way third waves move. The 0.618 near 5,000 is the first place I’d look for (c) to end, RSI is already at 23.
A close under 5,000 opens the trapdoor, and the next shelf is the 0.786 near 3,880. Ugly to watch, easier when the map was drawn first.

$KOSPI lost 6,000 this morning, down more than 5% with circuit breakers kicking in. Same CXMT memory scare that hit $MU yesterday, now Samsung and SK Hynix feeling it. Ugly day for Korea.
On my count the June top at 9,385 ended a five-wave run, and this is the (c) leg of the correction. (a) and a messy (b) are done, and (c) looks like it’s in its third wave now.
The 0.618 near 5,000 is where I’d expect it to end, right on the old wave ii shelf. Back above the (b) high near 7,200 and I’m wrong.


$NQ at 29,777 this morning, 6% off the top in a week!
On my chart the whole run from the August low is wave 1, topped near 31,700, and this is 2. The 0.5-0.618 box at 29,409-28,888 sits on the old summer shelf, that’s where I’d expect 2 to end, with the 200-day near 28,170 underneath.
Hot CPI, six red days in chips, Korea halted, and it still hasn’t reached the box. That’s what a 2 feels like from the inside.
Below the August low I’m wrong.
$NDX $NASDAQ


$ABBV tagged $283.43 yesterday, 21 cents under the $283.64 I had for (v), and sold off into a red close at $274. That’s 3 done for me, and honestly a cleaner top than I expected.
The average analyst target sits at $283, so that’s where the sellers were waiting. 4 should pull back into the $263-$253 box, the 0.236-0.382 of the whole rise from May.
Then 5 toward the 1.618 at $300.8. Under the (e) low near $258 I’d rethink the box.

Fifth waves out of triangles really don’t wait. $ABBV $281 now, three green days straight off the breakout.
First marker is $283.6, where (v) equals (i), then the 1.618 at $300.8. This (v) finishes a bigger 3 on my count, so I’ll enjoy the run!

