






Schools of choice in NYC clearly challenge the claim that poverty overrides anything schools can do to improve reading. Schools with solid programs can make a big difference.

Shouldn't the real question be how they plan to improve academic achievement in NYC public schools?
Take a look at this chart👇. There are charter schools in NYC with a high percentage of minority and economically disadvantaged students AND high academic achievement.
Schools that are serious about disparities in educational outcomes will focus on better instruction.

I don't think there is true, cause-establishing research on this question. There are correlations, but while educators constantly demonstrate ignorance of this fact, any decent introductory college statistics course points out that correlation cannot establish causation. Also, there are examples of high poverty schools that never the less produce notable performances. Read about some examples here: web.archive.org/web/20240529…
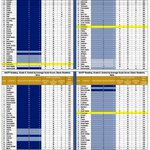
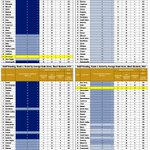
@plthomasEdD won't admit it, but MS actually is starting to show improvement in Grade 8 Reading compared to other states as of 2024. Here are factual examples produced with the NAEP Data Explorer.

Richard Innes retweeted

Good standards say what students will learn. Kentucky’s draft uses the word “may” more than 100 times. If content is optional, it isn’t a standard. bluegrassinstitute.org/socia…

Got more info on the scoring of Kentucky's 11th grade SAT tests. The scale used for the science score is only from 50 to 70. Wow! That permits almost no differentiation between top and bottom scorers and is hugely different from the 200 to 800 scale SAT uses for math and reading plus writing.
The table below shows the scoring for white and Black students on the Kentucky grade 11 SAT in 2026. The science scores can be converted to the regular 200-800 scale as follows:
(200-800 Science Score) = (((50-70 Science Score) - 50) X 30)+ 200
For white students, that works out to a 200-800 scale score for science of 488.
For Black students, the 200-800 scale score is 437.
The achievement gap, once we use a familiar scoring scale, is then 51 points.
So, do you think the published scores, using a scale no one ever uses or understands, showing a gap of only 1.7 points, is very revealing? Does this cover up a bigger problem? Did Kentucky get useful science information at all?

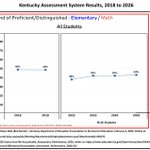
Next I looked at elementary school math for Kentucky in 2026. Again, I added the new scores on slides that were used last year to brief the state board on the 2025 results. Except for African Americans, the scores were perfectly flat from last year and in every case fewer than one in two students were proficient. There's nothing to cheer about here.


Kentucky's 2026 assessment and accountability results are out, and I already talked about a major concern with SAT testing. So, how about results from the Kentucky Summative Assessments. I added 2026 results to slides KDE used last year to report on the 2025 results. The first two are for elementary school reading. As you can see, there were small increases in scores, but even if we are talking about white students, scarcely more than one in two was proficient in reading in 2026, and the numbers are a lot worse for the minorities.


Kentucky released its 2026 public school assessment and accountability program scores today. My first puzzle involves scores from the 11th grade testing with the SAT, which replaced the ACT for the first time.
State law requires testing English, reading, math and science, but SAT only actually tests math and combined reading and writing. So, SAT said they would somehow create science scores for Kentucky from those two test elements (they ignored English completely).
Below is an example of what got reported today. Can anyone explain to me how science got scored so differently from the actual SAT subjects of math and reading and writing? How can anyone make much use of the science scores. Also notice how much smaller the achievement gap is with science. Does that seem credible?

@ChadAldeman just posted a really interesting substack, "Child Poverty Is Down. And Yet So Are Reading Scores." chadaldeman.com/p/child-pove….
He writes, "So if childhood poverty is generally down, surely reading scores are up? Nope, sorry, you must be new here."
Looks like additional evidence that there really is more to the reading problem than poverty. You can read some of the other evidence here: web.archive.org/web/20240529…

2/ New NAEP results in reading and math for 2026 testing are expected to be released in early 2027. It will be interesting to see how those scores compare to the claims just made by Virginia based on its own assessment program.
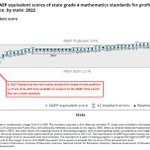
1/ Actually, the NAEP has provided a measure of rigor in state assessments for some time. The latest full report is "Mapping State Proficiency Standards Onto the NAEP Scales Results From the 2022 NAEP Reading and Mathematics Assessments" and is online here: nces.ed.gov/nationsreportcar…. The grading standard for proficiency on Virginia's Grade 4 reading and math and Grade 8 reading are among the very lowest in the nation.
A preliminary report on the 2024 NAEP results indicates that Virginia will continue to place very low in reading in both Grades 4 and 8. nces.ed.gov/nationsreportcar….
Virginia's Grade 8 math standards are not graded because the state offers two different assessments for general math and algebra I and that splits the tested cohort to below the criteria used in the mapping studies.


@drjohnthompson Your comment about Mississippi not showing improvement in Grade 8 reading is out of date. The tables below, created with the NAEP Data Explorer, show that at least compared to other states in the post-COVID era, Mississippi is starting to move up in NAEP Grade 8 Reading, too.

Kentucky has followed similar nonsense on its supposed reading assessments since the early 1990s. It's highly deceptive and eliminates any need to teach printed text decoding.
Richard Innes retweeted

In college, one of my education professors lamented that we could identify a struggling student in kindergarten and predict, with great accuracy, that he’d still be struggling in sixth, ninth, and twelfth grade.
He spoke as though the prediction itself helped cause the failure. But recognizing a problem isn’t the same as creating it.
What is actually cruel is watching that prediction come true while insisting the child remain in classes that move faster than he can learn, year after year, as he falls further behind, all while we congratulate ourselves for including him.
At some point, he needs instruction at a pace and level that will actually help him catch up. If that requires a different classroom, then we should give him one.
We talk about inclusion in a classroom as somehow providing a student access to education, but there is nothing compassionate about giving a child a front-row seat to an education he cannot access because we refuse to acknowledge his limitations.
The kicker though, is NAEP Proficient is the performance level needed to do well in college and living wage non-college careers. More on that here: storage.ghost.io/c/53/d3/53d…
Some great insight: Ten Years Later, Nikole Hannah-Jones Still Misses the Point. literatedlife.substack.com/p…
A factor in this is the terribly incomplete fiscal reporting in the Kentucky School Report Cards. This report has the details: static1.squarespace.com/stat…
BTW, the notable performance for Mississippi in Grade 4 is now starting to show in Grade 8, as well, at least compared to other states.

