






Pinned Tweet
1/ I become more and more dismayed by the huge number of supposed education experts who regularly use data from the NAEP improperly. In this thread I plan to outline some of the issues so the rest of us will have a better understanding of how people mislead with NAEP.
Schools of choice in NYC clearly challenge the claim that poverty overrides anything schools can do to improve reading. Schools with solid programs can make a big difference.

Shouldn't the real question be how they plan to improve academic achievement in NYC public schools?
Take a look at this chart👇. There are charter schools in NYC with a high percentage of minority and economically disadvantaged students AND high academic achievement.
Schools that are serious about disparities in educational outcomes will focus on better instruction.

Richard Innes retweeted

Good standards say what students will learn. Kentucky’s draft uses the word “may” more than 100 times. If content is optional, it isn’t a standard. bluegrassinstitute.org/socia…

Got more info on the scoring of Kentucky's 11th grade SAT tests. The scale used for the science score is only from 50 to 70. Wow! That permits almost no differentiation between top and bottom scorers and is hugely different from the 200 to 800 scale SAT uses for math and reading plus writing.
The table below shows the scoring for white and Black students on the Kentucky grade 11 SAT in 2026. The science scores can be converted to the regular 200-800 scale as follows:
(200-800 Science Score) = (((50-70 Science Score) - 50) X 30)+ 200
For white students, that works out to a 200-800 scale score for science of 488.
For Black students, the 200-800 scale score is 437.
The achievement gap, once we use a familiar scoring scale, is then 51 points.
So, do you think the published scores, using a scale no one ever uses or understands, showing a gap of only 1.7 points, is very revealing? Does this cover up a bigger problem? Did Kentucky get useful science information at all?

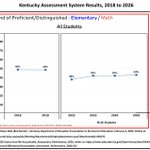
Next I looked at elementary school math for Kentucky in 2026. Again, I added the new scores on slides that were used last year to brief the state board on the 2025 results. Except for African Americans, the scores were perfectly flat from last year and in every case fewer than one in two students were proficient. There's nothing to cheer about here.


Kentucky's 2026 assessment and accountability results are out, and I already talked about a major concern with SAT testing. So, how about results from the Kentucky Summative Assessments. I added 2026 results to slides KDE used last year to report on the 2025 results. The first two are for elementary school reading. As you can see, there were small increases in scores, but even if we are talking about white students, scarcely more than one in two was proficient in reading in 2026, and the numbers are a lot worse for the minorities.


Kentucky released its 2026 public school assessment and accountability program scores today. My first puzzle involves scores from the 11th grade testing with the SAT, which replaced the ACT for the first time.
State law requires testing English, reading, math and science, but SAT only actually tests math and combined reading and writing. So, SAT said they would somehow create science scores for Kentucky from those two test elements (they ignored English completely).
Below is an example of what got reported today. Can anyone explain to me how science got scored so differently from the actual SAT subjects of math and reading and writing? How can anyone make much use of the science scores. Also notice how much smaller the achievement gap is with science. Does that seem credible?

Richard Innes retweeted

In college, one of my education professors lamented that we could identify a struggling student in kindergarten and predict, with great accuracy, that he’d still be struggling in sixth, ninth, and twelfth grade.
He spoke as though the prediction itself helped cause the failure. But recognizing a problem isn’t the same as creating it.
What is actually cruel is watching that prediction come true while insisting the child remain in classes that move faster than he can learn, year after year, as he falls further behind, all while we congratulate ourselves for including him.
At some point, he needs instruction at a pace and level that will actually help him catch up. If that requires a different classroom, then we should give him one.
We talk about inclusion in a classroom as somehow providing a student access to education, but there is nothing compassionate about giving a child a front-row seat to an education he cannot access because we refuse to acknowledge his limitations.
Some great insight: Ten Years Later, Nikole Hannah-Jones Still Misses the Point. literatedlife.substack.com/p…
Education commentators make the same sort of timing mistakes with Mississippi's reading gains. They expect results from this lower elementary school effort to show too soon in upper grades. That's poor analysis, just like those looking at an obviously decaying Finland situation thinking what has been going on there recently explains past success when different policies were in use. It's no surprise a lot of education research is weak. The analysis skills just are not there.

"Throughout the 1980s and into the 1990s, when Finnish students were making their big gains, schooling was quite centralized and prescriptive, and classroom instruction was traditional and teacher-led.
People were going to Finland after it became successful to study what its schools looked like at the time, rather than asking what Finnish schools looked like as the gains were occurring."
Smart piece by @ChadAldeman on the Finnish Falloff.
EdReformers may have read the wrong signals in their EduTourism.


Richard Innes retweeted

Recently I saw a post that said something along the lines of “No one really knows why there have been such declines in K-12 educational outcomes and no one has a plan to address it.”
We strongly disagree. A lot of people know why and have been fighting for decades for change.
Our thoughts in a nutshell:
School outcomes are poor due to ineffective classroom instruction.
The solution is more effective instruction at the school level.
The solution to the instruction issue is better training in the schools of education.
Our website is chock full of data and more of our thoughts as to why student outcomes are poor and what needs to be done to improve them.
Schools putting schools, not living conditions of students and citizens, first.

🚨 Breaking: KY school district admits a proposed data center may raise utility rates, while coordinating with KU to try to sell the project to the community.
Open records from Burgin Independent School District show a school board member who works for LG&E/KU, Ben Bradshaw, feeding the superintendent and other board officials KU talking points, confidential data-center scripts, tariff schedules, and revenue calculations so the district could sell the project to the community.
An early draft of a letter from Superintendent Chris LeMonds, which was shared with the full board, admitted that people on the KU grid could see infrastructure costs “reflected in utility rates” even if the data center were built somewhere else. The letter said any potential rate increase would be worth it because of the school’s projected $25–30 million annual windfall.
They calculated the school’s cut of the data center’s power bill alone at roughly $8.6 million a year in franchise tax. They then strategized about keeping public messaging focused on the “positive” money coming to the school while downplaying concerns about noise, pollution, and utility rates.
They also admit they don’t know how the proposed data center would cool its facilities, but wanted to keep pushing the idea that it would use a closed-loop system that consumes far less water because it would help sell the project to the community.
A KU employee serving on the school board and supplying company talking points certainly raises questions about who has control over Burgin’s elected local government.
This isn’t an isolated example. In previous ORRs I’ve posted, we’ve seen city council members and other local officials coordinating messaging with data center developers and the power company to promote these projects.
Who is actually running Burgin? Because based on these records, it certainly doesn’t look like the people who elected their local officials.
Richard Innes retweeted
No one demands that colleges of education demonstrate that the instructional practices they teach to teachers actually work in the classroom.
This should be kept in mind regarding all sorts of claims about education. Often neither side of the many arguments has much valid information to offer. xitter.cf/data_depot/status/2079…


It's disappointing, if not alarming, to see many in education pointing to the notable correlation between student wealth and test scores as an excuse that schools cannot overcome the low performance of poor students. Poverty is inevitably linked to low performance, these educators claim, and schools can't fix poverty.
In truth, any decent statistics 101 course teaches that a notable correlation between two sets of data does not establish causation, but it seems a lot of education folks never took such a course because the wealth-score correlation is encountered frequently as an excuse for low performance in schools.
But, the Stat 101 folks are correct, and here's some evidence to show that. Using a very neat score/poverty graphing tool developed by my friends at the Education Consumers Foundation, I generated this graphic for all the public schools in Virginia. Each school's dot is plotted at the junction of its school lunch eligibility rate and its 3rd grade reading proficiency rate in Virginia's annual school assessments.
Of interest are some schools that appear in the upper right corner of the graph. The identified schools all have far above average school lunch eligibility rates, but, in sharp opposition to the claims by correlation-blinded educators, these high poverty schools also have some really high 3rd grade reading proficiency rates.
Clearly, the correlation excuse for low reading performance for poor kids doesn't work. Given better instruction, poor students can learn to read much better. Such excuses, which essentially defend the status quo, are invalid.
It's not necessarily easy, and it does take time for staff to retool, but when staff isn't willing to accept the status quo, notable progress is possible even in high poverty situations.
Virginia isn't the only place where this correlation-breaking evidence can be found, either. You can read more about that in this report, which focuses on Kentucky. web.archive.org/web/20240529…

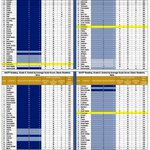
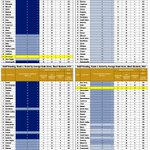
3/ I've been discussing some 2024 NAEP Grade 8 Reading results in another venue and thought some on X would like to see some of the tables that came from that discussion. Here is one showing how Hispanic students in each state compared to each other. Florida manages to score in the second-highest quartile, not the bottom. When you consider the fact that no state actually scored statistically significantly higher than Mississippi for Hispanic students, that doesn't seem like bottom of the pile performance, either.

2/ I've been discussing some 2024 NAEP Grade 8 Reading results in another venue and thought some on X would like to see some of the tables that came from that discussion. Here is one showing how Black students in each state compared to each other. Neither Black students in Mississippi nor Florida rank in the lowest quartile. In fact, they are at the high end of the second-highest quartile for Black scores.

1/ I've been discussing some 2024 NAEP Grade 8 Reading results in another venue and thought some on X would like to see some of the tables that came from that discussion. Here is one showing how white students in each state compared to each other.
A claim was made that Florida and Mississippi continue to rank in the lowest quartile of states for NAEP Grade 8 Reading although the states did well in Grade 4.
Here you can see that both Florida's and Mississippi's white students actually ranked above the lowest quartile for Grade 8 NAEP Reading.
Things will look even better when we check on Black and Hispanic students' results.

Are Kentucky's school district financial audits effective google.com/amp/s/amp.kentuck…?
