

The official twitter account of GRID, the Global Repository of Income Dynamics.
Princeton, NJ, USA
Joined April 2022
- Tweets169
- Following288
- Followers695
- Likes43



Read more at grid-database.org/research-p…

These results are possible because of admin panel data that broaden our view relative to cross-sectional statistics of the labor market. Following workers over time reveals patterns of formal attachment that shape the distribution and volatility of earnings in Colombia.
Across the groups, earnings are most unequal and most volatile among those who spend little time in formal work. Workers with steady formal jobs earn more, have more stable earnings, and are more likely to work at larger firms.
The remaining 8% initially averaged about 8 months of formal work per year. But their formal employment declined from 2015, then collapsed during the pandemic.
Another 28% increased their time in formal employment: 16% gradually, and 12% rapidly. In the former group, earnings rose faster, although in both groups they stayed below the cohort average.

The largest group, 42%, had persistently low formal employment, averaging just over one month a year, and the lowest earnings. This contrasts with the 22% identified earlier which paired high employment in each year and highest earnings in the cohort.

GRID team followed 3.55 million Colombian workers aged 25–30 in 2009 through 2024, grouping them by formal work history. How many were consistently formal throughout each year(>10 months)? Just 22%.
Only about half of Colombian workers are formal in any given month. But follow Colombians over time and formality looks… fragile. Few workers are persistently formal and even fewer hold a formal job for an entire year.
New research by @LeoMoralesZur, @socampdi & @Brenda_Sama👇

Congratulations to Robert Hall and Michael Woodford on receiving the 2026 Nobel Prize. Connecting microeconomic data and macroeconomic outcomes is central to our mission at GRID, and their work is a huge inspiration for our research agenda.
Read the full paper at grid-database.org/research-p…

So what happened in Taiwan?
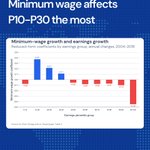
Lower earners pulled closer to the middle, and rising minimum wages appear to have contributed most around P10–P30.
The very bottom is different: there, how much people work matters as much as the wage itself.
Workers at the very bottom earn well below the full-year minimum-wage benchmark.
Their annual earnings also depend on employment intensity and attachment, so a higher statutory wage does not translate mechanically into higher annual earnings.
Twelve months of minimum-wage earnings correspond to roughly P17–P25 of annual earnings.
But the relationship between wage growth and minimum wage is essentially zero for P0–P10.
Why?
Meanwhile, Taiwan's statutory minimum wage has been raised every year since 2012.
This may be part of the story: the positive association is strongest around P10–P30 and fades toward the middle of the distribution, where the minimum wage matters less.

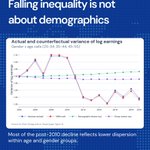
Could demographic changes explain this pattern?
Not really.
Almost all of the decline after 2010 came from falling inequality within demographic groups, not changes in the composition of the workforce.

Looking at the earning growth, the lower the percentile, the faster earnings tended to grow.
• P10 earnings grew by about 61%
• P25 by about 31%
• median earnings by about 17%
• P75 and P90 by roughly 12%

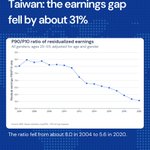
After adjusting for gender and age, the P90/P10 earnings ratio fells from 8.0 in 2004 to 5.6 in 2020. That’s one of the biggest falls in our dataset.

Taiwan is often in the headlines for geopolitics and chips. Here’s a different story: its earnings inequality fell considerably between 2004 and 2020.
New GRID research by Kuan-Ming Chen, @YuTingChiang4 , @ming_jen & Hsuan-Li Su investigates this trend 🇹🇼🧵
Read the whole paper at grid-database.org/research-p…