

The Complete Platform for Fundamental Stock Analysis Try free for 7 days! https://xitter.cf/t.co/QhWpMVvpJq
Tampa Bay Area, Florida
Joined August 2011
- Tweets10.2K
- Following1.7K
- Followers10.2K
- Likes1.2K



FAST Graphs retweeted
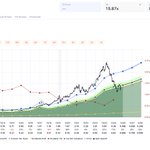
$XPEL is up 71,115% since December 2011 and most investors have never heard of it.
VALUATION (from @FASTGraphs):
Blended P/E: 21.85x
Normal P/E: 27.14x
Fair Value Ratio: 33.53x (P/E set equal to the 33.53% long term earnings growth rate)
EPS yield: 4.58%
Since December 2011 EPS is up 6,886%. So price outran earnings by about 10 to 1. The stock is currently still roughly 50% below its 2021 peak when the stock hit $103 and traded at a 90x P/E multiple. Everything since has been the multiple coming down while earnings kept growing.
THE BUSINESS:
XPEL sells paint protection film: a clear urethane layer installed over a car's paint that takes the rock chips and scratches instead of the paint, and heals light marks with heat. It also sells window tint, ceramic coatings and architectural window film.
Surprisingly, the company got its start in San Antonio in 1997 as a software company. The founders built a database of digital cutting patterns so installers could plot film to fit a specific vehicle instead of trimming it by hand on the paint with a razor. That software, DAP, is key to XPEL's success. It is the industry's largest pattern library, installers run their shops on it, and switching film brands means giving it up.
Ryan Pape became CEO in February 2009 with the stock at $0.04 and a market cap near $1 million, and put company debt on his personal credit cards to keep it alive. Revenue was roughly $3 million that year and under Pape's leadership, has grown to $476 million as of FY 25. Along the way XPEL bought its distributors in Canada, France, Australia and India, took a majority stake in its China distributor in 2025, and built its own installation centers. It now owns the software, the distribution and a growing share of the installs.
THE FUNDAMENTALS (2022 to 2025):
Revenue: $324M to $476M (13.69% CAGR)
Gross income: $128M to $201M (16.38% CAGR)
Net income: $41.4M to $51.2M (7.37% CAGR)
Operating cash flow: $12.1M to $66.9M (77.05% CAGR)
Operating margin: 16.65% to 13.03%
Return on equity: 38.05% to 19.69%
Return on invested capital: 28.23% to 17.58%
LT debt/capital: 22.85% to 5.51%
Over the last few years, Gross margin went up while Operating margin went down. The difference is operating expenses, which nearly doubled from $73.6M to $139.0M with revenue growing 47%. Net income grew at about half the rate of revenue. Cash is the bright spot. Operating cash flow went from less than a third of net income in 2022 to 1.3 times net income in 2025, and long term debt was cut to almost nothing.
EPS HISTORY:
2017: $0.04
2018: $0.32
2021: $1.14
2023: $1.91
2024: $1.65
2025: $1.85
2026 estimate: $2.22
2027 estimate: $2.89
2028 estimate: $4.10
$0.04 to $1.85 in eight years with one down year. In 2024 revenue growth slowed to 6% and EPS actually fell 14% as their Chinese distributor worked down inventory and high end car sales cooled. EPS Growth came back at 12% in 2025 and analysts model 20%, 30% and 42% in FY 26, 27, and 28.
THE CATCH:
The 33.53% growth rate behind the Fair Value Ratio covers the whole period back to 2012, when EPS was $0.05. The last three years net income grew at 7.37%. A 33.53x fair value multiple only means something if growth returns to something close to the old rate, and the estimates assume it does: 20% this year, 30% next year, 42% in 2028.
XPEL is currently at a cross roads. The company has never manufactured its own film. Historically, it has bought film from a supplier, and its edge was software, brand and distribution, which is how it earned a 28% return on invested capital with very little capital required.
In 2025 and 2026 management committed about $110 million to bring manufacturing in house: a 435,000 square foot site in San Antonio and a film plant in China. The San Antonio site alone cost $60.4 million. Management expects the margin benefit to start in mid 2027. Until then, the asset light company that earned the historical multiple is becoming a manufacturer.
At 21.85x against a 27.14x Normal P/E and a 4.58% earnings yield, XPEL screens as cheap relative to its own history, and the recent quarters hold up: Q2 revenue grew 14.7% with gross margin at 44.1%.
Two things to check before treating the discount as an opportunity. Whether operating margin turns back up from 13.03% now that the acquisitions are in the numbers. And the second half: first half 2026 EPS was $1.02, up 13%, so the $2.22 full year estimate needs about $1.20 in the second half, up 26% from the same period last year.
That acceleration either shows up in the Q3 report in November or the 20% estimate comes down.

FAST Graphs retweeted

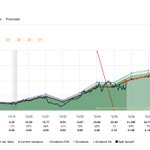
Someone dug this old gem up, so I checked the resulting outcome, 6+ years later.
The moral of the story is don't buy Clorox for 30x earnings and don't lend money to the government for a 0.6% yield.
If you do, you're gonna have a bad time.


Clorox $CLX trades at nearly 30 times earnings and grows at a low single-digit growth rate per year. Dividend yield is 2.2%.
Question: Would you rather buy and hold that for the next ten years, or a 10-year Treasury note yielding 0.6%?




FAST Graphs retweeted

BREAKING: Trump has said, "We may be cutting income tax almost completely because of tariff proceeds."
FAST Graphs retweeted
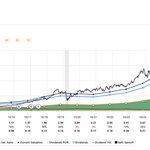
This is going to be wildly unpopular. But it’s time to sell $GOOGL
2 years ago the narrative was that Google was a dying company. I disagreed with that and believed they were positioned to be a leader in AI.
Today, everyone thinks Google is going to win AI.
I think the company will be fine and do well, but estimates have increased significantly and the multiple has expanded. So even if Google trades at a P/E of 30 and hits the raised EPS expectations, you get a 16% total return on your shares.


Someone stop me from buying more $GOOGL if it gets into the $80s.
Where is there a better R/R right now?
FAST Graphs retweeted

After joining FastGraphs in one week my Dividend income went up $2,000 a year. Selling over value stocks with a high gain, Buying lower value stacks with higher dividend yield.


FAST Graphs retweeted

Has anyone already said that $NVO is underrated? 😅
It has never been valued so low so far
#investing @FASTGraphs #FinTwit

FAST Graphs retweeted

What is Stock Valuation? | FAST Graphs
#investing #stockmarket #stocks
youtu.be/HmJeAhagFXk?si=JVGw…

FAST Graphs retweeted
See this Instagram video by @fast_graphs instagram.com/reel/DQo6oYrje…
FAST Graphs retweeted

If you’re just getting started in the REIT world and you’re looking to buy up just one REIT...
I suggest this one: widemoatresearch.com/wide-mo…

FAST Graphs retweeted
7 reasons that $REXR is poised to profit 🚀🚀🚀🚀
1) Cash SSNOI of +3.9% in Q2-25
2) Leasing activity was strong at 1.7 msf
3) Generated FFOps of $0.59 above Street
4) Balance sheet solid at 4.2x Net Debt + Pfd/EBITDA
5) Valuation attractive at 18.3 P/AFFO (normal 33.0x)
6) 4.6% dividend yield (payout ratio of 83%)
7) Consensus growth estimates of 4% in 26 and 27
@FASTGraphs


FAST Graphs retweeted
$TPL down 35% over last 90 days and @LeoNelissen provides a well-written BUY thesis (on Seeking Alpha) as he explains,
"...on top of not having any debt, it has sky-high margins, as its capex and opex are minimal. It does not produce oil and gas. All it does is allow others to produce on its land and invest in hardware for water sales, among other minor things."
He adds,
"I'm 100% annoyed but 0% worried."
Nice work Leo!
cc: @porterstansb
