

The official twitter account for https://xitter.cf/t.co/Smhdl3aYG0, by the @adamcchang lab.
Singapore
Joined April 2018
- Tweets150
- Following9
- Followers604
- Likes132



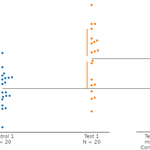


② Users may add a baseline error curve to shared control contrast plots, displayed below the control group. This is the distribution of the bootstrapped mean differences from comparing the control against itself and is a measure of inherent variability within the control group.

We have also added several features not yet present in the Python version of the package:
① As you may have noticed from the images in the thread below, we have adopted asymmetrical swarmplots, thereby better showing the distribution underlying the raw data.


Updated documentation for the R package can be found at: acclab.github.io/dabestr/
Contributors to this update were:
Kah Seng LIAN (github.com/sunroofgod),
Zhuoyu WANG (@LucasZhuoyu, github.com/Lucas1213WZY),
and Jun Yang LIAO (github.com/junyangliao)
④ Last but not least, we introduce the mini-meta plot, a quick way to do meta-analytic averaging from similar experiments. This provides an easy way to summarize results from multiple replicates. This makes meta-analysis of primary data available as a convenient tool.

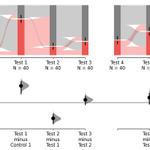
③ Instead of Fisher’s exact test for the comparison of proportions, you can now use the new DABEST proportion plots. It plots the variance of the observed binary counts and the effect-size curve of the difference of proportions. This function can be used with repeated measures.


For example, ∆∆ plots will be useful for genotype × drug analyses or optogenetic (light × opsin) experiments. A major benefit of the ∆∆ plot is how it places focus on the overall effect size.

② Instead of using a 2-way ANOVA, you can now generate a ∆∆ plot (‘delta-delta plot’) to visualize a 2 × 2 experiment. The ∆∆ shows individual effect sizes for each of the two-groups sub-comparisons, and the overall magnitude of the interaction effect.
Repeated-measures plots enable you to see a series of effect sizes relative to a baseline measurement.

① First up, in dabestr Lapis, a new graphic is suited for repeated-measures effect sizes. You no longer are stuck running repeated-measures ANOVAs, but can instead visualize best-practice estimation plots.
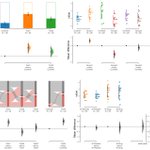
Exciting news for dabestr users! We are releasing dabestr version “Lapis” (v2023.9.12), which adds estimation graphics for four new data types: repeated measures, 2 × 2 designs, proportions, and easy meta-analyses. 🧵
How do dabestr users prefer to get future releases? (2/2) #rstats #DataScience
62%Prefer to get from CRAN
23%Prefer to get from Github
15%Don't mind either
13 votes • Final results📢To our R users: We will soon release a new version of dabestr (acclab.github.io/dabestr/) with brand new goodies such as repeated measures, proportion plot, mini-meta and delta-delta. #rstats #datascience We want to know how you prefer to get the package (poll in next tweet): 1/2

(Apologies for redoing this tweet thread, our previous images were showing up as sensitive content. This has now been fixed.)
An early testimonial for v2023.02.14:
xitter.cf/MathuruLab/status/1639…

A very useful update @SangyuXu, @adamcchang and everyone else involved.
We are already using it! 👍🏾
Contributors to this update were Yixuan LI, Rou ZHANG (@ZhangRou99), Zinan LU (@_Jacobluke), Joses HO (@jacuzzijo), Yishan MAI (@myish_irl), Sangyu XU (@SangyuXu), Hyungwon CHOI, and Adam Claridge-Chang (@adamcchang). 13/13
We hope you get a chance to use DABEST v2023.02.14 in your work. We hope to hear your feedback here and on Github. We have been working on an R version that we aim to release eventually. The new documentation (github.com/ACCLAB/DABEST-pyt…) has tutorials for the new functions. 12/13
④ Finally, we introduce the mini-meta plot, a quick way to do meta-analytic averaging of data from different experiments. This provides an easy way to summarize results from multiple replicates. This makes meta-analysis available as a routinely accessible tool. 11/13

ALT Image of a mini-meta plot.
③ The DABEST proportion plot can replace Fisher’s exact test for the comparison of proportions. It plots the variance of the observed binary counts and the effect-size curve of the difference of proportions. This includes Sankey diagrams for paired proportional data. 10/13

ALT Image of a bar plot for proportional data.

ALT Image of a Sankey diagram for paired proportional data.
