

Data you wont get anywhere else. Built by @dRiskDave.
Joined March 2026
- Tweets65
- Following1
- Followers28
- Likes209

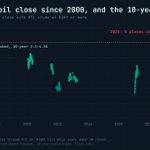




We went through every daily close since August 2000. Oil has closed at $100 or more on 568 days, but only 5 of those also had the 10-year Treasury yield at 5% or higher, and all 5 are from this fall.
Before this year the highest 10-year on any $100 oil day was 4.26%, back in 2008. Method: Yahoo WTI front-month and 10-year yield closes, 6,564 days. Not a forecast.

Worth keeping in mind where "falling" starts from though. Every $100 oil close since 2000 vs the 10-year that day: before this year the 10-year never got above 4.26% on any of them, and this fall 5 of them were over 5%.

Elleo retweeted

$SPCX: Some really happy SpaceX engineers today. Cursor S-8: 44.6M options with an average strike of $1.65. The stock closed at $145.23 today.
Payday.

$SPCX: SpaceX's biggest remaining unlock is Dec 8: up to 797.6M shares.
It's that big because an August early release never triggered. It needed a close of $175.50 (30% over the $135 IPO price) on 5 of the 10 days into Q2 results. Best close in that window: $125.33.
After Dec 8, up to ~1.76B more unlocks in steps through mid-2027, plus Musk's 6.4B on Jun 12, 2027.
"Up to" = allowed to trade, not sold.

Into today's Fed decision (11 AM PT), bitcoin is the calmest market on our board.
Its last 5 days rank 6 out of 100 against its own past year. The 10-year Treasury yield ranks at the top, about 100. Nasdaq 88, dollar/yen 83.
Bitcoin is usually one of the jumpiest things we track. This week bonds are doing the moving.
Method: spread of the last 5 daily moves, ranked against every 5-day stretch in the past year. Not a forecast.

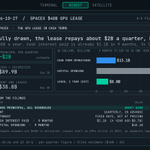
$SPCX: SpaceX's $40B GPU lease in cash terms, from the 8-K + Q3 10-Q: fully drawn it's ~$2B a quarter of principal before interest (our estimate, $40B ÷ 20). 9-month operating cash flow was $13.1B, capex $48.1B, cash + securities $89.9B. cash interest paid is already $2.1B YTD, 3x last year. leases start as GPUs arrive in 1H27.

The 10-year Treasury closed at 5.31% on Oct 5.
Highest close since May 2002 (5.32%).
Friday: 5.00%. Dec 31: 4.18%. The 2023 peak was 4.98%.
The whole curve is up this year:
3-month 3.67 → 4.22
2-year 3.47 → 4.69 (+1.22 pts)
10-year 4.18 → 5.00
30-year 4.84 → 5.33
At or above 5% on 24 trading days since Sep 15.
Checked against every daily close Treasury publishes since 2000. Fed decides Wednesday.


Bitcoin still trades on Saturday. It just barely moves.
Average daily move, Yahoo daily closes (00:00 UTC):
Saturday: 1.54% before US spot ETFs (2018 to Jan 10 2024), 0.75% since
Weekdays: 2.69% before, 1.98% since
Saturday moves fell 51%. Weekday moves fell 26%.
Weekends now carry 13.5% of bitcoin's price variance. An even split (2 of 7 days) would be 28.6%.
Limits: the ETF launch is a split date, not proof of cause. Past data, not a forecast.

US gas storage looks comfortable: 3,644 Bcf, 1.0% above the 5-year average (EIA, week to Oct 16).
Zoom into the Gulf Coast and it doesn't. South Central salt caverns, the fast-cycling storage nearest most LNG export terminals, hold 251 Bcf: 14.9% below the 5-year average, 21.1% below a year ago, and the lowest mid-October level since 2018.
The day that report came out, QatarEnergy signed to buy Henry Hub-priced LNG from Sabine Pass and Corpus Christi through 2054.
The national number averages the Midwest and the Gulf. Export demand pulls on the Gulf. That's the line we track on the Supply Board.

Nasdaq futures are down 1.7% this morning and Bitcoin is selling with them. We checked how that usually goes.
Last 5 years, QQQ closed down 2% or more on 86 days. Bitcoin fell the same day on 78% of them, median −2.3%.
30 days later, Bitcoin was higher 48% of the time. On any day in the same window: 52%.
So the selloff is shared, and the next month is close to a coin flip either way. A bad Nasdaq day tells you a lot about Bitcoin's today and almost nothing about its next month.
Limits: Bitcoin's "day" is the UTC calendar day, so it overlaps the US session without matching it, and the 86 events overlap in time, so they aren't independent.

Oil is quoted per barrel. European gas in euros per megawatt-hour. US gas in dollars per million BTU. Three units, so most screens never put them side by side.
Here they are in one unit of heat this morning (front-month futures, $ per MMBtu):
Europe gas (TTF): ~$29.6
Brent crude: ~$19.4
US gas (Henry Hub): $2.81
Europe is paying 10.5x what the US pays for the same gas. In 2017–19 that ratio sat around 2.2x. The 10-year median is 3.4x. The March 2022 peak was about 15x.
Why the gap can stay open: US gas can only leave the country as LNG, and export capacity is fixed in the short run. When oil and European gas reprice on a supply scare, Henry Hub can sit still.
That spread is a cost line for every European chemical plant, steel mill and fertilizer maker. On our Supply Board it sits in one unit, with the conversion printed under the chart.

The Rhine at Kaub reads 11 cm this morning. That number will get quoted as if the river is nearly empty. It isn't.
A gauge reading is a level against a fixed zero, not a depth. Kaub's official low-water mark (GlW) is 77 cm, and at that mark the shipping channel is maintained at 1.90 m. Today the gauge is 66 cm under the mark, so the channel is an estimated 1.24 m (1.90 m minus 66 cm).
That still bites. Barges load to draft, so lost depth is cargo left on the dock and a higher freight rate. But "barges sail light" and "the Rhine is shut" are very different trades.
That's the rule on our Satellite board: every physical read sits next to the official reference it's measured against, and the baseline is named.

The standard robustness check: don't trust the best backtest cell. Trust the plateau.
We ran the textbook version on $SPY. Long/flat moving-average crossover, 339 fast/slow pairs, next-bar fills, 5 bp per switch.
1994–2009: 335 of 339 pairs beat buy-and-hold on Sharpe. A big, smooth, green plateau.
2010–2026: 4 of 339 did. The best in-sample pair (35/230) ranked #230.
Nothing here was overfit in the usual sense. The plateau was real. It just belonged to a regime: the 2000 and 2008 bear markets, which a trend filter sidesteps. Take those away and almost the whole grid loses to holding.
A plateau tells you a result isn't fragile to its parameters. It tells you nothing about whether it's fragile to the market. Those are two different tests, and most backtest reports only run the first.
The second test: split by regime, not just by date, and make the strategy beat its baseline in each one.

1/ The research mistake that fooled us longest wasn't a bug. It was a habit: going back to the holdout "just one more time."
Every peek turns your out-of-sample data into a backtest. Here's the math, and the rule we use now. 🧵
4/ Our rule now: the backtest can nominate a strategy. Only forward data that didn't exist when it was built can promote it.
Every look at held-out data counts as a trial and goes in the log. The holdout gets opened once, and the answer stands.
