An alliance for practical political education so that people can learn how to use power for good
- Tweets21.5K
- Following4K
- Followers1.9K
- Likes10.9K



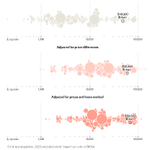





ALT The chart drills into more detail about how the burden is shared, recording tax payments across the income spectrum in one recent year. Four things jump out. First, the totality of direct taxes is progressive. Second, the variation between the very top and the bottom is huge, even on average: around 12 per cent of what the poorest families have coming in goes out in Income Tax, National Insurance and Council Tax; for the very richest that figure is 31 per cent, more than three times higher. Third, the progressive work of the system is to some extent done by National Insurance, but much more particularly by Income Tax, a levy that the very richest pay more than five times more of than the poorest. Finally, and in sharp contrast to the general pattern, Council Tax is strongly regressive – absorbing only about 1 per cent of income at the very top, against nearly 5 per cent at the very bottom.


ALT Chart showing in many countries, people see their fellow citizens as morally good.


ALT The end of the sort of progress on living standards that used to be regarded as automatic should be alarming, but there is a dreadful sense in which it has become Britain’s ‘new normal.’ A few years ago, the Resolution Foundation’s Economy 2030 report highlighted just how much worse off British families of modest means were than their Dutch, German and Canadian compatriots. The chart confirms that, after adding five years of new data, the international shortfall continues to afflict middle Britain as well as the bottom.