

Top KOL on @Tradingview & CMC | Partner Bitunix : https://xitter.cf/t.co/cPvXNLbdEV | Weex: https://xitter.cf/t.co/7HdMeVb0Qh | Free Alpha : https://xitter.cf/t.co/5jE0vlNboy
Moon
Joined July 2018
- Tweets7.3K
- Following374
- Followers15K
- Likes2.2K




Pinned Tweet
Since so many of you asked for it, it’s finally here! 🎉
Together with @BitunixOfficial , we’re launching our new monthly campaign to reward our community.
🚀 Here’s what you can earn:
🎁 Up to 8,000 USDT in Futures Bonus
💵 Up to 5,000 USDT in Real USDT
📈 Exclusive Deposit Rewards + Trading Volume Rewards
Whether you’re a new or existing trader, don’t miss this opportunity to maximize your rewards.
⏳ Campaign Period: 21 July – 20 August
🔗 Join here:
bitunix.com/activity/basic/C…
Let’s make this our biggest campaign yet! 🚀
#Bitunix

bitcoin:native: Forming a Bullish structure; next leg up likely! 🚀
Bitcoin is showing signs of a bullish reversal on the 4H chart, holding above $80,600 while forming a potential higher low.
BTC is reclaiming the moving averages and testing the $82,800–$83,000 resistance zone. RSI is also turning upward, supporting the recovery.
Bullish targets:
🎯 $83,800
🎯 $84,600
🎯 $86,200
A clean breakout above $83K could open the door for a rally toward the descending trendline resistance near $86.2K.
As long as BTC maintains its higher-low structure, I'm leaning toward further upside.
Invalidation: 4H candle close below $80,600.
Stay patient, zoom out, and let the setup play out.
DYOR. NFA.
#Crypto

Perfect,so far 💪
BTC holding above 82k with a new HL and possibly a HH on close:
Alts showing strength in LTFs.


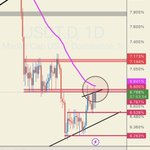
$USDT Dominance: Rektober or a BEAR TRAP?
USDT.D is trading around 6.88%, recovering from its recent lows and approaching a key resistance zone.
Here's what I'm watching:
6.88%–6.95%: Immediate resistance. A rejection here could trigger another move lower in USDT.D, potentially benefiting BTC and altcoins.
7.17%: Key resistance. A breakout and sustained move above this level could signal further downside for the crypto market.
6.75%–6.65%: Immediate support. Losing this zone would strengthen the bearish outlook for USDT.D and be extremely bullish for BTC and Alts.
5.95%–5.75%: Potential downside target if bearish momentum accelerates.
RSI is recovering, so a short-term bounce in USDT.D remains possible. However, the price is approaching a crucial resistance confluence.
My view: I want to see USDT.D reject resistance and resume its downtrend. That would be a positive signal for crypto, particularly altcoins. Not to forget, BTC is still holding the $80k zone.
DYOR. NFA.
#CryptoNews
#BTC Update!
Bitcoin is still moving sideways, with no major move in either direction yet.
Price is consolidating below the descending trendline, while the $80.3K support zone remains important.
Until we get a clear breakout or breakdown, I’m waiting for confirmation before looking for the next move.

The timing, though! 😁
ethereum:0xdac17f958d2ee523a2206206994597c13d831ec7 Dominance: The best positions are often built when you're too uncomfortable to enter the market.
Start with small positions for swing trades you're comfortable holding for a few weeks, then add more as higher-timeframe confirmations come in.
I'm adding to my altcoin bags right now.
Invalidation: HTF close above 7.17%.
DYOR. NFA.
#Crypto
$BTC Update
The previous $86.8K resistance rejection is playing out, and the recovery attempt has failed to reclaim the trendline.
I’m watching this support closely. A breakdown could open the door toward lower levels, while a strong bounce and reclaim of $81.6K would offer some relief to buyers.
For now, BTC needs to defend this zone. The next move depends on how price reacts here.

bitcoin:native is testing a descending trendline on the 2H timeframe after bouncing from the $80.5K support zone.
Price is making a recovery, but sellers are still defending the trendline. A breakout above $84K–$84.5K could open the door for a move toward $85K–$86K.
On the downside, losing $81.6K could bring the $80.5K support zone back into focus.
For now, I’m watching for a confirmed breakout or rejection before expecting the next major move.

#ETH has lost the rising channel and is now breaking below the lower support of its accumulation range on the 12H timeframe.
The $2,400 zone has failed to hold, and price is now approaching the $2,310 Fibonacci level. If selling pressure continues, the next important area to watch is $2,160–$2,105.
IMO, the structure is turning bearish. However, I’d like to see a confirmed 12H close below the range before treating this as a clean breakdown. A quick reclaim of $2,400 could still turn this into a false breakdown.
For now, the key is whether ETH can recover the range or continues moving lower.

It’s not over yet. $BTC will bottom with a higher low. There’s no reason to panic.
Zoom out and ignore the noise!
Invalidation;: Daily close above the EMA!
Go touch some grass. 🌱
Stay strong, folks! 💪

🚨 US CPI UPDATE 🇺🇸
US inflation came in hotter than expected!
📊 Actual CPI: 3.7%
📊 Forecast: 3.6%
📊 Previous: 3.4%
Rising fuel prices pushed inflation higher, adding pressure on the Federal Reserve. This could reduce hopes for easier monetary policy.
🔴 Bearish risk for BTC & altcoins: A stronger USD and rising yields could put pressure on crypto.
🟢 What could change the picture? Softer core inflation, falling yields, or a strong BTC recovery could limit the downside.
⚠️ My take: The CPI surprise leans bearish, but watch Bitcoin's price action before taking a position. Volatility is expected.
DYOR. NFA.
bitcoin:native #CPI
litecoin:native A Key Area to Watch
#LTC has pulled back sharply after its rally toward $75 and is now sitting right around the previous breakout zone at $59–$61.
In my view, this is where things get interesting. The 0.382 Fib level near $61.35 is also being tested, making this an important area for buyers to defend.
If LTC manages to hold this zone, we could see a bounce toward $66–$70. However, a breakdown below $59 would make a deeper retracement toward $56.7 more likely.
Personally, I’d like to see how price reacts here before taking a position. The next move around this zone could set the tone for LTC in the coming days.

bitcoin:native is testing a descending trendline on the 2H timeframe after bouncing from the $80.5K support zone.
Price is making a recovery, but sellers are still defending the trendline. A breakout above $84K–$84.5K could open the door for a move toward $85K–$86K.
On the downside, losing $81.6K could bring the $80.5K support zone back into focus.
For now, I’m watching for a confirmed breakout or rejection before expecting the next major move.
$ETH Update
#ETH has broken below the rising channel, showing weakness in the short-term structure. However, price is still trading inside the broader accumulation range, with support around $2,400–$2,450.
As long as this support holds, a recovery is still possible. A breakdown below the red box could open the door toward the $2,310 support zone.
For now, I’m watching how ETH reacts at the lower boundary. A confirmed breakdown or a strong bounce from this zone will help determine the next move.

$BTC Weekly Update
#BTC is still facing strong resistance around $86.8K, and the latest weekly candle is showing some rejection from this level.
As mentioned in the previous analysis, a clean weekly close above $86.8K is needed to confirm a breakout and open the door toward $104.5K, followed by the $123.5K area.
On the downside, another rejection could bring the $73.8K support back into focus. Losing that level would weaken the recovery further.
For now, BTC is at a critical resistance zone. I’d wait for the weekly close before making any major directional call.

$BTC Weekly Update
#BTC is testing a major weekly resistance around $86.8K.
This level is important because it previously acted as a strong support/resistance area, and BTC is now back at the same zone after a strong recovery from the ~$54.9K–$57K area.
The current weekly candle is still below $86.8K, so I’d like to see a clean weekly close above this level before considering it a confirmed breakout.
If BTC breaks and holds above $86.8K, the next major resistance on this chart is around $104.5K, followed by the previous ATH zone around $123.5K.
On the other hand, another rejection from $86.8K could bring the $73.8K area back into focus.
For now, $86.8K is the key level on the weekly timeframe.
The next weekly close could be very important for BTC.

$ETH Update
#ETH is testing a crucial support zone around $2,500 after getting rejected from the $2,700–$2,800 resistance area.
On the daily timeframe, a close below $2,500 could increase selling pressure and open the door toward $2,310. If that level fails, the next supports to watch are around $2,160 and $2,000.
However, ETH is still trading inside the broader rising channel. If buyers defend the current zone and price reclaims $2,600, we could see another attempt toward $2,700–$2,800.
For now, I’m watching how ETH reacts around $2,500. A confirmed breakdown or a strong recovery from this zone could determine the next move.
Not rushing into a trade until we get confirmation.

🚨 @BitunixOfficial x Cryptorphic: New Monthly Campaign is LIVE! 🚨
We’ve been proudly partnering with Bitunix for over 18 months now, and this time we’re back with another massive round of rewards for the community.
Here is what you can claim this month:
🎁 1. Deposit Bonus (New Users):
• Deposit & hold for 7 days + hit trading milestones to earn up to 20% in bonuses (up to 400 USDT)
🏆 2. Trading Volume Rewards
• Climb the volume tiers to win up to 12,000 USDT Futures Bonus + 8,000 Real USDT in withdrawable rewards
🗓 Campaign Period: Sep 26 – Oct 25, 2026 (UTC+0)
⚠️ Eligibility: Must register using our link below. Bonuses are valid for 14 days once activated.
👉 Register & Claim Here:
bitunix.com/register?vipCode…
#CryptoTrading #Bitunix


$BNB Update
#BNB has broken below the rising channel support on the 4H timeframe and is now trading around $743, putting short-term momentum under pressure.
On the daily timeframe, price has also dropped below the 0.236 Fibonacci level near $746. If BNB fails to reclaim this zone, the next supports to watch are $719, followed by $706 and $674 near the 0.382 and 0.5 Fibonacci levels.
My view is that further downside remains possible unless BNB reclaims the broken support and the $760 resistance zone.

$BNB Update
#BNB is still holding inside the broader rising channel on the 4H timeframe, which remains important for the short-term structure. As long as price continues to respect this channel and stays within the current range, the broader bullish momentum remains intact.
On the daily timeframe, I’m watching the $760 level closely. A daily close below $760 would be an important confirmation that the current move is reversing and could open the way toward the 0.5 Fibonacci retracement and potentially the previous support zones below.
Until we get that daily close below $760, I wouldn’t consider the reversal confirmed yet.
For the short term, the key is the rising channel. Holding the lower boundary could keep the parabolic structure alive and allow BNB to push higher again, while a clean channel breakdown would be the first sign that momentum is starting to weaken.
My view: BNB remains bullish while these key supports hold, but after such a strong move, I’d prefer to see how price reacts at the channel support rather than chase the upside here.

Perfect so far. We’re already seeing signs of recovery across the market.
#Crypto

