

Tweets ≠ advice. Analyst since 1998. Monitoring charts for macro trends, changes, extremes and THEMES: 2025: Precious Metals, Int'l 2026: Commod, Int'l
Joined November 2012
- Tweets2.5K
- Following59
- Followers802
- Likes5.8K
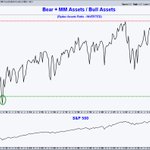




RATIO: Bear + Money Market Assets / Bull Assets
Here is an inverted chart to show just how bullish the dumb money is compared to 2009-2011 levels. The complacency picture has flip flopped. Anyone's guess if this 5% level can go any lower, but it is getting very stretched.


A lot has happened this week. Be sure to catch up on the best charts at The Chart Report and The Morning Print this weekend! If you have not already, favorite the following link to see all of the best charts curated daily: thechartreport.com/
@TheChartReport


Commodities - $PDBC
The volume is still well below what we saw in 2022. That continues to suggest this move still has a ways before it matures.

Commodities - $PDBC
The volume this week is so far away from the high volume we saw in 2022. That suggests this move still has a long ways before it matures.


Jim Knarr retweeted

BREAKING: South Korea’s KOSPI falls another -7% as tech stocks drop sharply.
The KOSPI is now down -40% from its record high seen on June 19th.


Jim Knarr retweeted

how many people do you know buying stocks from Brazil and India while selling the Korean ones?

Diverging Forces are Shaping the Economy - $EWY $XLE
Figure 1.1 in IMF World Economic Outlook
imf.org/-/media/files/public…

