

Free Android app with 37+ charts and expanding. These are my opinions only and are not Financial or Investment advice. Consult an investment professional.
Cambridge, Ontario
Joined March 2024
- Tweets4K
- Following188
- Followers783
- Likes55.6K




Pinned Tweet
Version 1.1.5 of Canada Stats Hub for Android is now available! More than one hundred charts and the ability to create your own. You can now download data directly from StatsCan. Install now!
See link and instructions in the comments ->>>

StatsCan just released the August retail sales. The month was pretty good at 1.2%, but the quarter is weakening compared to Q1 and Q2 positive runs. Canadian retail has behaved in fits and starts since 2022. 5.2% YoY is not that great when real life inflation is more like 4% YoY and population growth was revised up to 0.5% YoY. More charts in the comments.


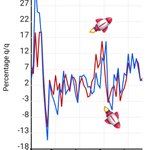
2/3 The quarter over quarter retail chart shows how much of a rollercoaster it has been for Canadian retail spending since 2022. It feels like households get tapped out by inflation for a year, than try to catch up again.

StatsCan just released the new housing price index. It is down 0.2% last month and 2% YoY. Meanwhile inflation is running at 3%. That means a 5% loss in real terms. Quite the investment... Land is also rolling over YoY we must be approaching capitulation.

The BoC is between and rock and a hard place: the IPPI just printed a lava hot 14.5% YoY. They will have to raise 25 bps or 50 bps before the economy starts to flounder even further. Only hourly pay is holding inflation back ATM.

This time is always different...

Hidden interest expense from off-balance sheet debt is over $230 billion or 9% of aggregate S&P 500 GAAP earnings. That puts the Shiller P/E ratio at an all time high of 45.3. Full report (free) here: newconstructs.com/sp-500-ear…

StatsCan just released the M2 money supply data. It was showing some recovery in the last few months, but it is now down again at 4% YoY. Likely a reflection of a moribund real estate lending growth. It seems that Q3 GDP might disappoint unless oil exports save it.


The latest household mortgage debt growth shows how slow the real estate market really is: 3.7% YoY is only matched by the 90s housing crisis and the dot com bubble burst.

StatsCan just released the household debt figures. It clearly shows that mortgages debt growth is historically low: 3.7% YoY (90s crisis levels). Other debt is growing at 5%, which is high and might be peaking soon.


What a picklethe BoC is in: slow economy, high unemployment, crashing RE market and 3.1% inflation YoY. They might raise rates 25 bps/50 bps just to pause or lower them again in 6 to 9 months. Inflation YoY will likely drop like a rock in April 2027 when the oil shock rolls over 12 months.

Inflation ticked up again to 3.1% YoY in September. Even worse, food is up 37% since 2019. Shelter and transportation are up 34%. Good luck getting 34% worth of raises in 6 and a half years. Demand destruction activate...

Most of Canada's 3.1% YoY inflation is transportation. If oil doesn't go to the moon, this should reverse sharply in Q2 2027. Food and shelter have lost a significant share of the total YoY inflation.

Canadian Inflation excluding transportation is below 2%. This is setting up for a large reduction in inflation YoY in March/April of 2027 when the jump in oil prices roll outside the 12 month window.

This short term inflation chart shows that Canadian inflation is peaking at around 3% YoY if oil doesn't go much higher ($120 to $160 a barrel). If the war is resolved, inflation YoY (not cumulative of course) will drop like a rock in Q2 2027.

Breaking! Canada CPI year over year came at 3.1%, which is a slight increase from 3.0%. Core measures are stabilizing. If oil were to go down, 2027 might have much lower YoY inflation. This is cold comfort to households since families deal with the cumulative effect, not YoY.

