

May God's will be done on earth as it is in heaven
- Tweets4K
- Following127
- Followers212
- Likes11.4K



ALT A chart of 12 time series of the daytime air temperature in the area of Nepal (27.3N, 85.5E) where the recent landslide occurred, from 2002 to 2026, sourced from the NASA Giovanni data portal. These are satellite data, measured by the AIRS instrument on the Aqua satellite. Each series represents the annual data for one of the 12 months. The linear regression slope of each month is posted to the left. Slopes are in degrees C per year change. This chart is for the pressure level of 500 mb, which is about 5600 m above sea level, or slightly higher than the elevation the glacier above the landslide was at. Slopes are indistinguishable from zero for all months, meaning there is no observed air temperature warming in the 21st century at this location.
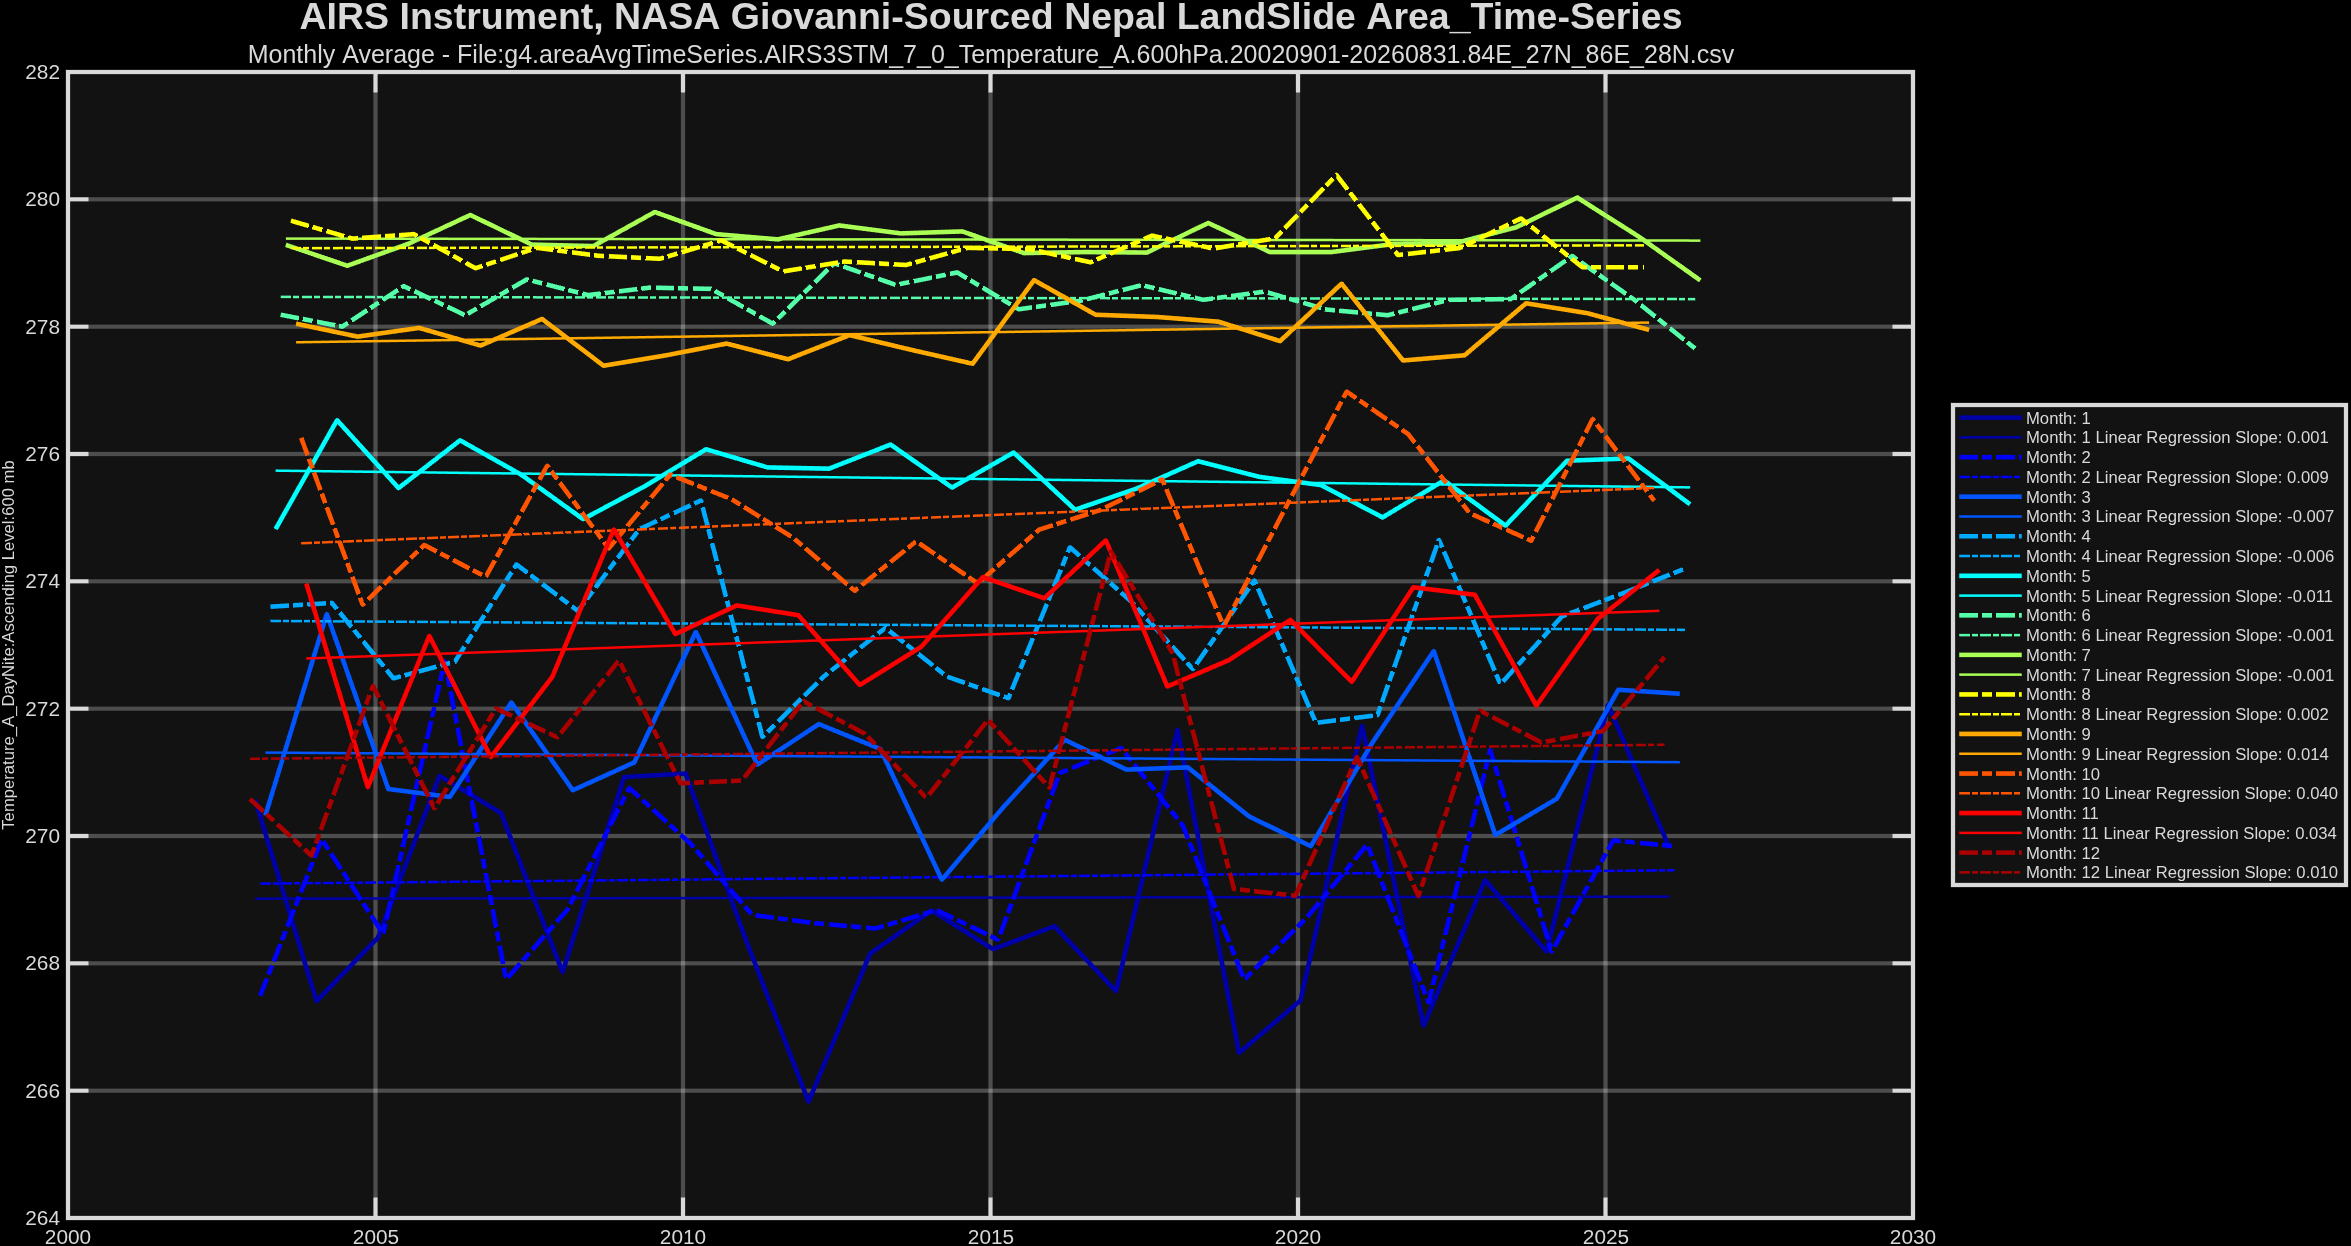
ALT A chart of 12 time series of the daytime air temperature in the area of Nepal (27.3N,85.5E) where the recent landslide occurred, from 2002 to 2026, sourced from the NASA Giovanni data portal. These are satellite data, measured by the AIRS instrument on the Aqua satellite. Each series represents the annual data for one of the 12 months. The linear regression slope of each month is posted to the left. Slopes are in degrees C per year change. This chart is for the pressure level of 600 mb, which is about 4400 m above sea level, or slightly below the elevation the glacier above the landslide was at. Slopes are indistinguishable from zero for all months, meaning there is no observed air temperature warming in the 21st century at this location for this pressure level.


ALT A pixel map of the contiguous US states, showing the forested areas by type from the NLCD_ConusV1 database, down sampled from the original resolution to approximately 3 km by 3 km.

ALT A time series of the area weighted monthly average vapor pressure deficit for the monthly April to August, daytime maximum value. The trend is for those gridcells that are coded as conifer forest, deciduous forest, and mixed forest from the NLCD_ConusV1 database. Data source for the VPD is the PRISM database covering the CONUS. The time series shows that while there has been an increase in the VPD for summertime forested areas in the US, the overall trend since 1895 to 2026 is flat, maybe even slightly declining.


ALT A global map of the R-squared coefficient from regression, by month, by grid cell of the upwelling shortwave radiation measured by the CERES satellite instruments at the top of the atmosphere, regressed against the total daytime cloud fraction measured by the AIRS satellite borne infrared scanner. The map shows the very strong correlation between the cloud cover anomaly and the upwelling shortwave anomaly. Not shown on this map is the relation, which is positive: more cloud = more upwelling shortwave radiation. The correlation is less strong in the polar latitudes since they are covered by sea ice and snow much of the time they get daylight, so cloud cover doesn't increase upwelling shortwave except for the short summer in the north. Antarctica is mostly snow covered year round so there, clouds don't make a difference, maybe even slightly decrease upwelling shortwave, as the clouds scatter the incoming solar shortwave.

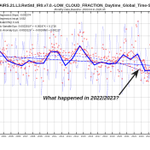
ALT A comparison chart of 2 time series: blue is the weighted average of the upwelling or reflected solar radiation from 2002 to 2026, compared to the changes in daytime total cloud fraction as detected by satellites. These are the monthly weighted by area averages over the oceans between 60N and 60S. This area was chosen since the oceans are where energy is absorbed and the 60S to 60N is where the incoming & outgoing radiation flux at the top of the atmosphere determine the radiation balance of the earth. The thick solid lines are rolling 12 month averages o the monthly anomalies which are the fine dash dot lines. The chart clearly shows by the strong correction between these 2 metrics that cloud cover changes are what is driving changes in reflected solar radiation, at least over the 21st century.


