Cross-Platform Data Visualization Tools 📊 JavaScript charts 📈 Qlik extensions ➕ more for #DataViz and #Analytics ✨ #qlik #javascript #frontend #webdev

Joined April 2009
AnyChart retweeted
One Qlik tenant, two fully customized hubs. Different brands, different content, same source, no duplicated apps. That’s NewHub for Qlik Cloud, now running @AnyChart's own environment. Want to poke around? DM me and I’ll send you access.
1
1
1
56
AnyChart retweeted
Would you investigate a 22% KPI miss before a 4% miss? Suppose the 22% has run all year and the 4% just started. Only one of them is new information. 🔥 New guide to chart types for performance against target, the question each answers & the trap in each anychart.com/blog/2026/09/16…
2
3
106
AnyChart retweeted
Most BI dashboards report what happened. Almost none are built to answer why. Seven charts do that second job. And you rarely use just one. 💥 Just published a guide to chart types for root cause analysis, including the ways each one can mislead: anychart.com/blog/2026/09/02…
1
2
188
AnyChart retweeted
since you guys loved the exploding tesla.. I used GPT-6 Astra to create a 3D website that pulls apart the male anatomy into 2,234 modeled pieces! we are in a renaissance of learning
1,151
5,423
1,026
53,340
8,038,218
AnyChart retweeted
Excel is still a daily tool for analysis. Qlik Sense is built for governed analytics. 📝 We published a comprehensive guide to using both, and when each approach makes sense: → Exports & imports → Automation → Live connections → Embedded spreadsheets Read it on our blog.
1
2
4
528
AnyChart retweeted
What drew Saugata Saha to Qlik — and what does he see ahead? In his first conversation as Qlik CEO, Saugata shares why he joined, where he sees opportunity across data + AI, and what customers and partners can expect next. Watch: bit.ly/45SQdTM
2
1
2
812
AnyChart retweeted
#Qlik has a Sankey. We built one for the flows that outgrow it. Try our new Sankey Chart extension for Qlik Sense, designed to visualize multi-stage flow analysis when the native chart runs out of room. Learn more & check it out: qlik.anychart.com/news/circu…
3
5
330
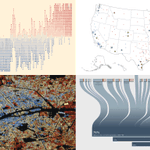
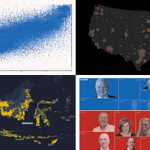
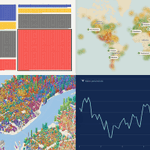
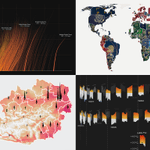
The best data visualizations of July 2026 - maps, charts, and interactive stories worth studying. 🗺️📊 anychart.com/blog/2026/07/31… Image source: AnyChart / respective original authors #Geoawesome #DataVisualization #Cartography #Maps
1
13
65
3,456
AnyChart retweeted
🌟 16x a Leader! 🌟 Qlik has once again been named a Leader in the 2025 Gartner®️ Magic Quadrant™️ for Analytics and BI Platforms, marking our 16th year in a row helping customers turn data into action. Download the report: bit.ly/44DIoRe
1
2
428
Spain are world champions. 🏆 The final turned on a single moment — Ferran Torres, 106th minute, deep in extra time. One goal to decide the World Cup. Every pass, shot and goal is real match event data from Opta, rebuilt in 3D. #SPAARG #WorldCup2026 #WorldCupFinal #Campeones #Spain #football #soccer #dataviz
78
1,281
188
9,119
877,142
AnyChart for Android, Android charting library Renders dozens of built-in chart types in Android apps on API 19+
1
1
1
51
AnyChart retweeted
Qlik didn't have it. We built it for Qlik. Just released the Circular Dendrogram extension for Qlik Sense — a radial tree for org charts, product taxonomies, account hierarchies, file structures, and other nested data. Learn more and check it out: qlik.anychart.com/news/circu…
1
1
188
AnyChart retweeted
80+ years of U.S. presidential approval data (Gallup). Visualized as a vertical area chart in #JavaScript. Our new tutorial shows how to build it: → Mirrored areas → Smooth spline curves → Date/time scale → Highlighted zero baseline → Custom tooltip anychart.com/blog/2026/04/09…
1
1
228
AnyChart retweeted
"Make no mistakes DO NOT HALLUCINATE. YOU ARE AN EXPERT SOFTWARE ENGINEER"
186
2,063
192
23,852
1,389,824
AnyChart retweeted
Still exporting to Excel just to update a template? 💡 There is a better way in Qlik: Import your #Excel template into #Qlik Sense. ✅ Keeps layout, formulas, charts ✅ Syncs with live Qlik data ✅ Work stays in the app, no version drift See our tutorial. Link in reply 👇
1
2
3
409
All things must pass... except perhaps Reddit? (by @chartrdaily)
9
33
5
158
29,924
AnyChart retweeted
Happy Holidays! 🎄 This sweater is a nod to our top release this year: 🌟 Spreadsheets for Qlik Sense BI tools like @Qlik evolve, but Excel stays in the last mile, triggering the export loop. Our extension keeps familiar spreadsheet work inside Qlik apps. Thanks for a great 2025!
1
2
166
AnyChart retweeted
Your #Qlik apps keep getting smarter. But users still ask for #Excel. Export → edit → share → bring back 🔁 Now you can keep Excel-style spreadsheet work in-app: cell editing, formulas, multi-sheet, charts, and more. Connected to live Qlik data. 📽️ New tutorial on our blog.
1
6
420