
Domain Investor • Real sales data, prices, terms, profits, market reports & studies on 4L patterns • Email: [email protected]
Joined October 2025
- Tweets302
- Following36
- Followers1.8K
- Likes34

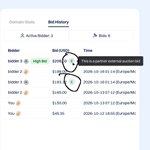




I do not know where the information that QDA .com sold for $5,655 came from. The auction ended with a final bid of more than $26,000. I participated in the Dynadot auction for this domain.
I did not wait until the end of the auction because the bids became extremely high and did not make sense to me. However, I took a screenshot about 30 minutes before the auction ended, showing how the auction was going.
As in 99% of similar cases when bids become unusually high, the leading bidders were users with 0 previous purchases on the platform.
@Dynadot, could you please clarify what happened in the end: who won the auction, what was the final price, and on which platform the sale was completed?


$5,655 for a LLL .com 😱 🤯 someone got a weekend special three letter .com. Time to watch @usesav auctions again.


4L. com portfolio update: December 2024–September 2026
For 21 consecutive months, from December 2024 through August 2026, my analyzed four-letter .com portfolio was profitable using a standardized renewal cost of $10.18 per domain per year.
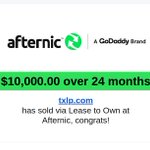
September ended that streak. It was also the first full month of my experiment with a fixed $10,000 asking price for every domain included, with a 24-month Lease to Own (LTO) option.
Under those conditions, September produced zero sales. Revenue stopped, while the ongoing cost of holding the portfolio remained. That resulted in a $17,399.15 loss under the same renewal-cost calculation used throughout this report.
This is the context behind the September decline: it occurred during a deliberate change in pricing.
The updated report now covers 22 months, from December 2024 through September 2026. All amounts are in USD:
• Gross domain sales: $771,092
• Domains sold: 353
• Average sale price: $2,184.40
• Profit using standardized renewal costs: $220,231
• Profitable months: 21 out of 22
• Domains held at the end of September: 20,874
December 2024 is the starting point because that was when I fully moved my sales to Afternic, switched to Afternic nameservers, and adopted more realistic pricing. The results reflect that combination of changes.
Despite September’s setback, the longer-term figures show progress.
Comparing the same nine-month periods:
January–September 2025:
• 188 domains sold
• $315,140 in gross sales
• $1,676.28 average sale price
• $91,921 in profit
January–September 2026:
• 114 domains sold
• $342,000 in gross sales
• $3,000 average sale price
• $106,333 in profit
Even after including September’s loss, gross revenue increased by 8.5% and profit by 15.7% compared with the same period in 2025.
Sales volume fell by 39.4%, while the average price achieved increased by 79.0%. Fewer sales generated more revenue and more profit.
For me, that is an important distinction. Higher realized sale prices had been compatible with a profitable portfolio. However, September’s much higher blanket asking price produced no transactions.
The portfolio also grew. Holdings increased from 15,973 at the end of December 2024 to 20,874 at the end of September 2026 — approximately 30.7%.
That growth matters when interpreting the results. A larger portfolio carries a larger renewal obligation, and sales counts need to be considered alongside portfolio size and sell-through rate.
Profit is calculated consistently throughout the report: sales revenue minus fees, the original acquisition cost of the domains sold, and portfolio renewal expenses.
Renewals are standardized at $10.18 per domain per year, prorated for the reporting period. These figures do not represent the exact renewal invoices paid in each month.
Purchases of domains still held are not deducted from this profit figure. The reported profit therefore should not be interpreted as cash flow or a return on all the capital invested in the portfolio.
Across these 22 months, standardized renewal expenses totaled approximately $348,185, accounting for 45.2% of gross sales revenue. The resulting profit margin was 28.6%.
The separate group of 2,768 less liquid domains being sold off at lower prices remains excluded from this analysis.
September’s updated figures were:
• Domains sold: 0
• Gross sales revenue: $0
• Standardized renewal expense: $17,399.15
• Profit / loss: −$17,399.15
With no sales, cumulative revenue and the historical average sale price stayed unchanged. Renewal expense reduced accumulated profit from approximately $237,630 at the end of August to $220,231 at the end of September.
My interpretation remains that a blanket $10,000 asking price is too high to produce sustainable results for the ordinary, random four-letter .com domains in my portfolio. Individual names may sell at that price, but enough sales need to occur to cover the cost of holding the entire inventory.
The 24-month LTO option did not produce a sale during September.
As announced previously, I am continuing the experiment through October under exactly the same conditions: a fixed $10,000 asking price and a 24-month LTO option.
The next update will show whether a second full month produces a rebound. I will evaluate the results against this historical benchmark, using sales volume, sell-through rate, revenue, and profit after expenses.
All updated charts are in the comments below.


🚨 9 aged 4L .com domains are now up for auction on @Dynadot!
💰 Current bid: $1 USD each
✅ No reserve
⏳ Auction duration: 7 days
Domain — registered → expires:
jqje .com — 2007-07-16 → 2028-07-16
jiqj .com — 2007-09-05 → 2028-09-05
jijq .com — 2012-09-20 → 2028-09-20
qoqj .com — 2007-10-15 → 2028-10-15
qjaj .com — 2009-11-07 → 2028-11-07
jejq .com — 2005-11-15 → 2028-11-15
ajqj .com — 2007-01-19 → 2029-01-19
ejjq .com — 2012-02-16 → 2029-02-16
qijq .com — 2009-06-07 → 2029-06-07
Looking for an affordable 4-letter .com? Join the auctions and place your bids!
#DomainsForSale #DomainAuction #4Lcom
Update: Atom's 4L domain auctions are over. The last-minute bids did arrive. The impressive results apparently had other plans.
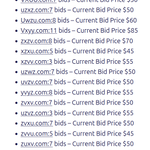
I gave Atom a second chance. Here are the final bids:
vxuu .com - $80
zuxv .com - $65
zvvu .com - $75
zvxu .com - $70
uzvz .com - $80
zvxv .com - $65
uvzv .com - $70
uzxz .com - $70
xzvv .com - $65
xzxu .com - $70
zxzv .com - $80
vxyy .com - $85
uwzu .com - $90
xyxv .com - $75
vyzw .com - $70
zvvw .com - $75
yvyz .com - $75
uzwz .com - $70
yzvv .com - $75
19 domains. $1,405 in total final bids. An average of $73.95 per domain before fees. Highest bid: $90.
Similar domains have easily sold for $100 each in my @NamePros auctions, with no commission to pay.
Based on this experience, I strongly advise against using Atom for domain auctions (No reserve). The marketplace felt dead, and these results haven't changed my impression.
Atom got its second chance. A third would be an act of charity.


I usually sell my less liquid domains through auctions on NamePros, but I decided to give Atom a second chance and join their scheduled 4L .com auction.
It opened on September 30, 2026, at 1:00 PM and closes tomorrow, October 5, at 1:00 PM.
With one day left, here's the excitement so far:
• 19 domains listed.
• 12 sitting at $10, with just one bid each.
• Highest current bid: $85.
Apparently, "premium marketplace" also means premium peace and quiet.
Yes, last-minute bidding may push the prices up tomorrow. But so far, the place feels deserted, and buyers with actual budgets are keeping an impressively low profile.


September results: zero sales at $10,000 per domain.
Throughout September 2026, each four-letter .com domain included in my experiment (20864 random 4L .com domains) was priced at a fixed $10,000, with a 24-month Lease to Own (LTO) option.
You can read more details about the experiment in my thread on @NamePros:
namepros.com/threads/explori…
The result for the entire month was zero domains sold.
The same analyzed portfolio that had been profitable for 21 consecutive months, from December 2024 through August 2026, became unprofitable in the very month I raised the asking price.
September's figures were:
• Domains sold: 0
• Gross sales revenue: $0
• Prorated renewal expense: $17,378.52
• Net result after renewals: -$17,378.52
As in my previous report, renewal expenses are calculated at a standardized rate of $10.18 per domain per year, prorated for the reporting period. This keeps the September result comparable with the previous 21 months. It does not mean that I paid that exact amount in renewal invoices during September.
The separate group of 2,768 less liquid domains being sold off at lower prices remains excluded from this analysis.
For context, during the previous 21 months, the analyzed portfolio generated 353 sales, $771,092 in gross revenue, and $237,630 in profit using the same standardized renewal-cost assumption.
That worked out to approximately 16.8 domains sold, $36,719 in gross revenue, and $11,316 in profit per month. Monthly results varied, but every single month was profitable.
September ended that streak.
The ongoing cost of holding the portfolio remained, while sales revenue fell to zero. Making a 24-month payment option available did not produce a sale during the month.
Personally, I see little reason to continue the experiment. To me, September's result is clear and entirely consistent with the results of my pricing experiments in 2023 and 2024.
My view remains that a blanket $10,000 asking price is too high to produce sustainable results for the ordinary, random four-letter .com domains in my portfolio. Individual domains can sell at that price or above it. The question is whether enough of them will sell to make the portfolio profitable after expenses.
Still, I can already anticipate the objection: September was simply an unlucky month, and if I had continued, perhaps I would have sold 15-20 domains at $10,000 each the following month.
I do not want to keep revisiting that hypothetical argument after ending the experiment.
So I will continue through October under exactly the same conditions: a fixed $10,000 price for each domain included in the experiment, with the same 24-month LTO option.
My interpretation of September has not changed. I am extending the experiment to give it another full month and see whether the suggested rebound actually happens.

Based on my own comparable sales, your asking price seems reasonable to me. But I would keep expectations for a quick sale modest.
In 2026, I have sold similar four-letter .com domains from my portfolio for $3,500.
For a group of 2,500 domains, each containing exactly one letter from the set I classify as less desirable, my recorded results were an annualized ROI of 3.81% and an annual sell-through rate of 0.64%.
Across my full sales history for similar domains, the average sale price was $1,808, with an annualized ROI of 6.26% and an annual sell-through rate of 1.27%.
To express those sell-through rates in years, we can use a simplified calculation. If every domain had the same chance of selling and that chance stayed constant over time:
An annual sell-through rate of 0.64% would correspond to an average waiting time of approximately 156 years for one domain.
An annual sell-through rate of 1.27% would correspond to an average waiting time of approximately 79 years.
These are theoretical averages, not predicted sale dates. A domain could sell next month or remain unsold throughout your ownership. Individual names have different prospects, and market conditions will change long before those time periods pass.
The purpose of expressing these figures in years is to show how low the annual probability of selling one particular domain can be. Across 2,500 domains, a 0.64% annual sell-through rate is equivalent to about 16 sales per year. A large portfolio can therefore generate regular sales even while the chance of selling any one name remains small.
In my data, the lower average sale price was associated with a higher sell-through rate and a higher annualized ROI. That supports my preference for lower pricing when I want to improve turnover.
However, $1,808 is the average price of my completed sales. It does not establish what would happen if you listed this particular domain for $1,800. Other differences between the periods may also have affected the results.
The choice is yours: accept a lower price to try to improve the chances of selling sooner, or hold out for a higher price while accepting a potentially much longer wait and continued renewal costs. Waiting longer does not guarantee that the higher-priced sale will eventually happen.

I am currently running an experiment with a fixed price of $𝟭𝟬,𝟬𝟬𝟬 𝗳𝗼𝗿 𝗲𝗮𝗰𝗵 𝟰𝗟.𝗰𝗼𝗺 𝗱𝗼𝗺𝗮𝗶𝗻 𝗶𝗻𝗰𝗹𝘂𝗱𝗲𝗱 𝗶𝗻 𝘁𝗵𝗲 𝗲𝘅𝗽𝗲𝗿𝗶𝗺𝗲𝗻𝘁, with a 𝟮𝟰-𝗺𝗼𝗻𝘁𝗵 𝗟𝗲𝗮𝘀𝗲 𝘁𝗼 𝗢𝘄𝗻 (𝗟𝗧𝗢) option.
To give myself a clear benchmark for evaluating this experiment, I decided to share my portfolio statistics for 𝗗𝗲𝗰𝗲𝗺𝗯𝗲𝗿 𝟮𝟬𝟮𝟰 𝘁𝗵𝗿𝗼𝘂𝗴𝗵 𝗔𝘂𝗴𝘂𝘀𝘁 𝟮𝟬𝟮𝟲. That is 21 months of results, covering four-letter .com domains.
December 2024 is an important starting point. That was when I fully moved my domain sales to @Afternic and switched my domains to Afternic nameservers.
Before that, I mainly used Dan and Dynadot. I kept my asking prices high because I wanted to collect enough data to understand how those prices would perform across my portfolio. The portfolio was unprofitable during that stage, but accepting those losses while gathering data was a deliberate decision.
By December 2024, I felt I had enough information to conclude that those high prices were not a sustainable approach for the ordinary, random four-letter .com domains in my portfolio. I started pricing more realistically and continued experimenting.
Since I changed both the sales platform and my pricing approach, the results below reflect that combination of changes.
𝗧𝗵𝗲𝗿𝗲 𝗶𝘀 𝗮𝗹𝘀𝗼 𝗮𝗻 𝗶𝗺𝗽𝗼𝗿𝘁𝗮𝗻𝘁 𝗲𝘅𝗰𝗹𝘂𝘀𝗶𝗼𝗻 𝗳𝗿𝗼𝗺 𝘁𝗵𝗶𝘀 𝗮𝗻𝗮𝗹𝘆𝘀𝗶𝘀: 𝗮 𝗴𝗿𝗼𝘂𝗽 𝗼𝗳 𝟮,𝟳𝟲𝟴 𝗱𝗼𝗺𝗮𝗶𝗻𝘀 𝘁𝗵𝗮𝘁 𝗜 𝗮𝗺 𝗰𝘂𝗿𝗿𝗲𝗻𝘁𝗹𝘆 𝘀𝗲𝗹𝗹𝗶𝗻𝗴 𝗼𝗳𝗳 𝗮𝘁 𝗹𝗼𝘄 𝗽𝗿𝗶𝗰𝗲𝘀.
These domains meet both of the following conditions:
• They contain 𝟯 𝗼𝗿 𝟰 𝗹𝗲𝘁𝘁𝗲𝗿𝘀 𝗳𝗿𝗼𝗺 𝗝/𝗤/𝗨/𝗩/𝗪/𝗫/𝗬/𝗭.
• They contain 𝟬 𝗼𝗿 𝟭 𝗹𝗲𝘁𝘁𝗲𝗿𝘀 𝗳𝗿𝗼𝗺 𝗙/𝗚/𝗛/𝗞.
Based on my accumulated sales data, these are the least liquid names in my portfolio: they are the hardest to sell under my approach.
This group did generate a small profit over the reporting period when calculated using the much lower renewal costs I actually paid. However, my data suggests that, with my sales approach, these names would become unprofitable at regular current renewal prices, with any further price increases making the economics worse.
For that reason, I no longer see a good reason to keep them in the portfolio and continue renewing them. I have decided to sell them off at lower prices. They are all already renewed through 𝗺𝗶𝗱-𝟮𝟬𝟮𝟳 𝗼𝗿 𝗹𝗮𝘁𝗲𝗿, which gives me time to work through those sales before their next renewals are due.
𝗧𝗵𝗲 𝗳𝗶𝗴𝘂𝗿𝗲𝘀 𝗯𝗲𝗹𝗼𝘄 𝗲𝘅𝗰𝗹𝘂𝗱𝗲 𝘁𝗵𝗼𝘀𝗲 𝟮,𝟳𝟲𝟴 𝗱𝗼𝗺𝗮𝗶𝗻𝘀. They describe the portfolio I am analyzing separately from that sell-off.
For this analyzed portfolio, 𝗮𝗹𝗹 𝟮𝟭 𝗺𝗼𝗻𝘁𝗵𝘀 𝘄𝗲𝗿𝗲 𝗽𝗿𝗼𝗳𝗶𝘁𝗮𝗯𝗹𝗲, 𝘂𝘀𝗶𝗻𝗴 𝘁𝗵𝗲 𝗿𝗲𝗻𝗲𝘄𝗮𝗹-𝗰𝗼𝘀𝘁 𝗮𝘀𝘀𝘂𝗺𝗽𝘁𝗶𝗼𝗻 𝗲𝘅𝗽𝗹𝗮𝗶𝗻𝗲𝗱 𝗯𝗲𝗹𝗼𝘄.
All amounts are in USD.
𝗗𝗲𝗰𝗲𝗺𝗯𝗲𝗿 𝟮𝟬𝟮𝟰–𝗔𝘂𝗴𝘂𝘀𝘁 𝟮𝟬𝟮𝟲
• Gross domain sales: $𝟳𝟳𝟭,𝟬𝟵𝟮
• Domains sold: 𝟯𝟱𝟯
• Average sale price: $𝟮,𝟭𝟴𝟰.𝟰𝟬
• Profit using standardized renewal costs: $𝟮𝟯𝟳,𝟲𝟯𝟬
• Profitable months: 𝟮𝟭 𝗼𝘂𝘁 𝗼𝗳 𝟮𝟭
• Domains held at the end of the period, within this analysis: 𝟮𝟬,𝟲𝟳𝟭
On a monthly basis, that works out to approximately $𝟯𝟲,𝟳𝟭𝟵 𝗶𝗻 𝗴𝗿𝗼𝘀𝘀 𝘀𝗮𝗹𝗲𝘀, $𝟭𝟭,𝟯𝟭𝟲 𝗶𝗻 𝗽𝗿𝗼𝗳𝗶𝘁, 𝗮𝗻𝗱 𝟭𝟲.𝟴 𝗱𝗼𝗺𝗮𝗶𝗻𝘀 𝘀𝗼𝗹𝗱.
To make these results useful, I want to be clear about how profit is calculated. I deduct fees, the original acquisition cost of the domains sold, and domain renewal costs from sales revenue.
𝗙𝗼𝗿 𝘀𝗶𝗺𝗽𝗹𝗶𝗰𝗶𝘁𝘆 𝗮𝗻𝗱 𝗰𝗼𝗻𝘀𝗶𝘀𝘁𝗲𝗻𝗰𝘆, 𝗜 𝗰𝗮𝗹𝗰𝘂𝗹𝗮𝘁𝗲 𝗿𝗲𝗻𝗲𝘄𝗮𝗹𝘀 𝗮𝘁 𝗮 𝗳𝗶𝘅𝗲𝗱 𝗽𝗿𝗶𝗰𝗲 𝗼𝗳 $𝟭𝟬.𝟭𝟴 𝗽𝗲𝗿 𝗱𝗼𝗺𝗮𝗶𝗻 𝗽𝗲𝗿 𝘆𝗲𝗮𝗿 𝘁𝗵𝗿𝗼𝘂𝗴𝗵𝗼𝘂𝘁 𝘁𝗵𝗲 𝗿𝗲𝗽𝗼𝗿𝘁.
In reality, these domains were renewed at much lower prices in 2024 and 2025 because I transferred them to 𝗦𝗽𝗮𝗰𝗲𝘀𝗵𝗶𝗽 and took advantage of a substantial discount. The renewal figures in this report therefore exceed what I actually paid for those years.
I use $10.18 as my current market-price benchmark to show how profitable the portfolio can be at a regular renewal price, without moving domains between registrars to keep taking advantage of promotional discounts. This also gives me a consistent basis for comparing different periods and pricing experiments.
Over these 21 months, the expenses used in the calculation were approximately:
• $𝟭𝟭𝟭,𝟭𝟴𝟬 𝗶𝗻 𝗳𝗲𝗲𝘀
• $𝟵𝟭,𝟰𝟵𝟱 𝗶𝗻 𝗮𝗰𝗾𝘂𝗶𝘀𝗶𝘁𝗶𝗼𝗻 𝗰𝗼𝘀𝘁𝘀 𝗳𝗼𝗿 𝘁𝗵𝗲 𝗱𝗼𝗺𝗮𝗶𝗻𝘀 𝘀𝗼𝗹𝗱
• $𝟯𝟯𝟬,𝟳𝟴𝟲 𝗶𝗻 𝗿𝗲𝗻𝗲𝘄𝗮𝗹𝘀, 𝗰𝗮𝗹𝗰𝘂𝗹𝗮𝘁𝗲𝗱 𝗮𝘁 𝘁𝗵𝗲 𝗳𝗶𝘅𝗲𝗱 $𝟭𝟬.𝟭𝟴 𝗿𝗮𝘁𝗲
After those deductions, profit was $𝟮𝟯𝟳,𝟲𝟯𝟬, or approximately 𝟯𝟬.𝟴% 𝗼𝗳 𝗴𝗿𝗼𝘀𝘀 𝘀𝗮𝗹𝗲𝘀 𝗿𝗲𝘃𝗲𝗻𝘂𝗲. This is a profit margin, not a return on the total amount invested in the portfolio. The lower renewal prices I actually paid in 2024 and 2025 would make the profit higher than the figure shown here.
At the standardized rate, renewals were the largest expense, accounting for almost 𝟰𝟯% 𝗼𝗳 𝗴𝗿𝗼𝘀𝘀 𝘀𝗮𝗹𝗲𝘀 𝗿𝗲𝘃𝗲𝗻𝘂𝗲. That is a major part of the economics of holding a large domain portfolio. Sales need to cover the ongoing cost of keeping the inventory, including the many domains that do not sell during a given year.
This is also why the decision to sell off the less liquid group matters. A group of domains can show a small historical profit thanks to discounted renewals while still being unattractive to hold at the renewal prices I expect to pay going forward.
Monthly results varied considerably. Using the same renewal-cost assumption, profit ranged from approximately $𝟮,𝟰𝟬𝟬 𝗶𝗻 𝗙𝗲𝗯𝗿𝘂𝗮𝗿𝘆 𝟮𝟬𝟮𝟱 to $𝟮𝟭,𝟱𝟬𝟬 𝗶𝗻 𝗙𝗲𝗯𝗿𝘂𝗮𝗿𝘆 𝟮𝟬𝟮𝟲. Other strong months included April 2025 at around $20,600 and August 2026 at around $21,000.
For me, the most encouraging result is the consistency: even the weakest month remained profitable under this calculation. The analyzed portfolio showed a profit every month without needing the discounted renewal prices to achieve that result.
Sales volume also moved around, ranging from 𝟵 𝘁𝗼 𝟮𝟱 𝗱𝗼𝗺𝗮𝗶𝗻𝘀 𝗽𝗲𝗿 𝗺𝗼𝗻𝘁𝗵. A month with more sales did not necessarily produce more profit. The prices achieved and the expenses in that month both affected the final result.
The sale-price charts show another useful pattern: 𝗺𝗼𝗻𝘁𝗵𝗹𝘆 𝗮𝘃𝗲𝗿𝗮𝗴𝗲 𝗮𝗻𝗱 𝗺𝗲𝗱𝗶𝗮𝗻 𝘀𝗮𝗹𝗲 𝗽𝗿𝗶𝗰𝗲𝘀 𝘄𝗲𝗿𝗲 𝗴𝗲𝗻𝗲𝗿𝗮𝗹𝗹𝘆 𝗵𝗶𝗴𝗵𝗲𝗿 𝗶𝗻 𝟮𝟬𝟮𝟲 𝘁𝗵𝗮𝗻 𝗶𝗻 𝗲𝗮𝗿𝗹𝘆 𝟮𝟬𝟮𝟱, although there were fluctuations along the way.
Across the entire period, the average sale price was $𝟮,𝟭𝟴𝟰.𝟰𝟬. This is calculated by dividing total sales revenue by the 353 domains sold. It gives me a useful historical reference for the current pricing experiment.
The portfolio covered by this analysis also grew during the period. I purchased 𝟱,𝟰𝟬𝟵 𝗱𝗼𝗺𝗮𝗶𝗻𝘀, sold 𝟯𝟱𝟯, and finished August 2026 holding 𝟮𝟬,𝟲𝟳𝟭 𝗳𝗼𝘂𝗿-𝗹𝗲𝘁𝘁𝗲𝗿 .𝗰𝗼𝗺 𝗱𝗼𝗺𝗮𝗶𝗻𝘀.
That changing portfolio size matters when comparing results. The number of sales alone does not show how efficiently the inventory is selling. I also need to look at the sell-through rate: the percentage of the portfolio sold over time.
The chart shows monthly sell-through rates equivalent to roughly 𝟬.𝟲% 𝘁𝗼 𝟭.𝟴% 𝗽𝗲𝗿 𝘆𝗲𝗮𝗿. Monthly ROI figures, expressed at an annual rate, ranged from below 1% to just over 6%. These figures describe each individual month at a yearly pace; they are not the actual returns for the full 21-month period.
This brings me back to the $𝟭𝟬,𝟬𝟬𝟬 𝗳𝗶𝘅𝗲𝗱-𝗽𝗿𝗶𝗰𝗲 𝗲𝘅𝗽𝗲𝗿𝗶𝗺𝗲𝗻𝘁 𝘄𝗶𝘁𝗵 𝟮𝟰-𝗺𝗼𝗻𝘁𝗵 𝗟𝗧𝗢.
The asking price is substantially above my historical average sale price. Offering payment over 24 months may change how buyers respond, but the effect on the portfolio needs to be measured.
I want to see what happens to sales volume, sell-through rate, revenue, and profit under this setup. With LTO, I will also need to consider payments received and how many agreements reach completion.
These 21 months give me a concrete benchmark: 𝟯𝟱𝟯 𝗱𝗼𝗺𝗮𝗶𝗻𝘀 𝘀𝗼𝗹𝗱, 𝗮𝗻 𝗮𝘃𝗲𝗿𝗮𝗴𝗲 𝘀𝗮𝗹𝗲 𝗽𝗿𝗶𝗰𝗲 𝗼𝗳 $𝟮,𝟭𝟴𝟰.𝟰𝟬, 𝗮𝗻𝗱 $𝟮𝟯𝟳,𝟲𝟯𝟬 𝗶𝗻 𝗽𝗿𝗼𝗳𝗶𝘁 𝘂𝘀𝗶𝗻𝗴 𝗮 𝗳𝗶𝘅𝗲𝗱 $𝟭𝟬.𝟭𝟴 𝗮𝗻𝗻𝘂𝗮𝗹 𝗿𝗲𝗻𝗲𝘄𝗮𝗹 𝗰𝗼𝘀𝘁, 𝘄𝗶𝘁𝗵 𝗲𝘃𝗲𝗿𝘆 𝗺𝗼𝗻𝘁𝗵 𝗽𝗿𝗼𝗳𝗶𝘁𝗮𝗯𝗹𝗲.
I will use that history to evaluate whether the $10,000 price and 24-month LTO option improve the portfolio’s overall performance over time.
You can find all charts with the data in the comments under this post.


Sales of my 4L domains in August 2026
Primary sales channel: Afternic landers (Fast Transfer disabled).
Lander configuration: Custom lander with Buy Now (Tiers 9-12 include a 12-month LTO option).
Nameservers: Afternic NS1 / NS2.
Also listed as fixed-price domains on the Spaceship/Dynadot marketplaces.
