

Building Africa’s future onchain | Web3 Enthusiat | Hausa Community builder | Never stopping.
Kaduna, Nigeria
Joined May 2010
- Tweets21.1K
- Following2.4K
- Followers2.1K
- Likes43.3K







Pinned Tweet
Assalamu alaikum wa rahmatullah wa barakatuh.
GM x Fam
Inverse Head and Shoulders:
Forms at the end of a downtrend, signaling the market is nearing bottom and preparing to reverse upward.
Since buyers aren't yet strong, this reversal can take time to fully develop.

GM
Happy new week Fam
Assalamu alaikum wa rahmatullah wa barakatuh.
Wedges:
Signal indecision in the market, buyers and sellers are contesting direction.
Can act as either continuation or reversal; always wait for the breakout.
Rising Wedge: typically reverses price downward.
Falling Wedge: typically reverses price upward.
If it appears at the end of a downtrend, it acts as a reversal; if it appears within an uptrend, it acts as continuation.
GM
Happy new week Fam
Assalamu alaikum wa rahmatullah wa barakatuh.
Wedges:
Signal indecision in the market, buyers and sellers are contesting direction.
Can act as either continuation or reversal; always wait for the breakout.
Rising Wedge: typically reverses price downward.
Falling Wedge: typically reverses price upward.
If it appears at the end of a downtrend, it acts as a reversal; if it appears within an uptrend, it acts as continuation.
Assalamu alaikum wa rahmatullah wa barakatuh.
Happy Sunday Fam.
Flags:
Similar concept to pennants but rectangular instead of triangular.
For a bullish flag: take-profit = height of the "pole," stoploss = bottom of the rectangle, entry = break of the upper trendline (some wait for price to exceed the prior high first).
Assalamu alaikum wa rahmatullah wa barakatuh.
Happy Sunday Fam.
Flags:
Similar concept to pennants but rectangular instead of triangular.
For a bullish flag: take-profit = height of the "pole," stoploss = bottom of the rectangle, entry = break of the upper trendline (some wait for price to exceed the prior high first).
Assalamu alaikum wa rahmatullah wa barakatuh.
GM gm
Pennants:
Continuation patterns that form after a sharp price move, followed by a brief consolidation (resembling a small symmetrical triangle) before the trend resumes.
Bullish pennant: forms during an uptrend, signals a pause before continuing up.
Bearish pennant: forms during a downtrend.
Assalamu alaikum wa rahmatullah wa barakatuh.
GM gm
Pennants:
Continuation patterns that form after a sharp price move, followed by a brief consolidation (resembling a small symmetrical triangle) before the trend resumes.
Bullish pennant: forms during an uptrend, signals a pause before continuing up.
Bearish pennant: forms during a downtrend.
GM Fam.
Assalamu alaikum wa rahmatullah wa barakatuh.
Channels:
Formed by two parallel trendlines. Price bounces between the upper and lower lines until it eventually breaks out up or down.
The centre line acts as an internal support/resistance within the channel.
Assalamu alaikum wa rahmatullah wa barakatuh.
GM X Fam.
Double Bottoms:
A reversal pattern appearing at the end of a downtrend, sellers lose strength twice while buyers push back twice, forming a "W" shape.
Stoploss sits in the middle of the pattern; entry comes after the neckline breaks; take-profit equals the height of the pattern projected from the neckline. Typically offers 1:2 risk-reward or better.
Assalamu alaikum wa rahmatullah wa barakatuh.
GM X Fam.
Double Bottoms:
A reversal pattern appearing at the end of a downtrend, sellers lose strength twice while buyers push back twice, forming a "W" shape.
Stoploss sits in the middle of the pattern; entry comes after the neckline breaks; take-profit equals the height of the pattern projected from the neckline. Typically offers 1:2 risk-reward or better.
GM fam
Assalamu alaikum wa rahmatullah wa barakatuh.
Explaining Triangles patterns.
Triangles:
Symmetrical Triangle: Forms when two trendlines converge as buyers and sellers push against each other. It's neutral 50% chance up, 50% chance down.
Always wait for confirmation before entering.
Ascending Triangle: Forms when a rising trendline meets a flat resistance. Buyers are gradually winning, giving it a 70% chance of breaking upward vs. 30% downward. Wait for confirmation.
GM fam
Assalamu alaikum wa rahmatullah wa barakatuh.
Explaining Triangles patterns.
Triangles:
Symmetrical Triangle: Forms when two trendlines converge as buyers and sellers push against each other. It's neutral 50% chance up, 50% chance down.
Always wait for confirmation before entering.
Ascending Triangle: Forms when a rising trendline meets a flat resistance. Buyers are gradually winning, giving it a 70% chance of breaking upward vs. 30% downward. Wait for confirmation.
Assalamu alaikum wa rahmatullah wa barakatuh.
GM Fam
The 8 Patterns Covered:
1- Triangles (Ascending, Descending & Symmetrical).
2- Double Top & Double Bottom.
3- Channels (Ascending & Descending).
4- Pennants (Bullish & Bearish)
5- Flags (Bullish & Bearish).
6- Wedges (Rising & Falling).
7- Head and Shoulders & Reverse Head and Shoulders.
8- Cup & Handle and Inverse Cup & Handle.
Assalamu alaikum wa rahmatullah wa barakatuh.
GM Fam
The 8 Patterns Covered:
1- Triangles (Ascending, Descending & Symmetrical).
2- Double Top & Double Bottom.
3- Channels (Ascending & Descending).
4- Pennants (Bullish & Bearish)
5- Flags (Bullish & Bearish).
6- Wedges (Rising & Falling).
7- Head and Shoulders & Reverse Head and Shoulders.
8- Cup & Handle and Inverse Cup & Handle.
GM X Fam.
Happy new month.
Assalamu alaikum wa rahmatullah wa barakatuh.
What Are Chart Patterns?
Chart patterns are shapes traders identify on a chart that signal the market is about to move up or down.
Understanding these patterns helps a trader achieve significant success and profit in their trading journey.

GM X Fam.
Happy new month.
Assalamu alaikum wa rahmatullah wa barakatuh.
What Are Chart Patterns?
Chart patterns are shapes traders identify on a chart that signal the market is about to move up or down.
Understanding these patterns helps a trader achieve significant success and profit in their trading journey.
Assalamu alaikum wa rahmatullah wa barakatuh.
Jumu'ah Mubarak.
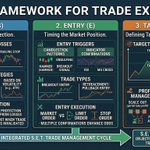
Take-Profit (Target):
Where the trader plans to take profit. Two main approaches:
1- Partial TP:- Profit is taken in stages (e.g., 50% at TP1, 30% at TP2, 20% at TP3), including "holding" where profit is withdrawn gradually while leaving some position running.
2- Complete TP:- Sometimes called "Dubai/Dawana'u" style:- Trader sets SL and TP, then doesn't touch the trade until one of the two is hit.

GM X Fam.
Assalamu alaikum wa rahmatullah wa barakatuh.
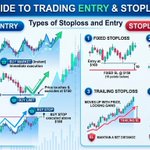
Types of Stoploss:
Structural stoploss:- Used when trading based on chart patterns.
Percentage-based stoploss:- Used when trading based on indicators.
Entry:
Entry is the point where a trader enters the market.
Different traders use different entry styles:
Aggressive traders:- Enter right after the breakout candlestick.
Confirmation traders:- Enter after a confirmation candlestick.
Retest traders:- Enter after price returns to retest the broken level.


Zik Gambo retweeted

If you see this pls 🙏 help me to repost and shire ko Allah zaisa sako na yaje inda ya kamata
@cacnigeria1 Still no resolution on my registration. I've made full payment, yet tickets F8G86267 and KKN60667 have both exceeded the 72-hour response window you promised and now your lines keep disconnecting whenever I try to call. Please provide an update.
#CACPortalDown #CACNigeria
Assalamu alaikum wa rahmatullah wa barakatuh.
GM X Fam
Happy new week.
Top-Down Analysis:
This means analyzing a market/coin across more than one timeframe.
Example: a scalp trader checks the 1H chart first, then the 15m chart.
Higher timeframe (1H): shows support/resistance, where price is coming from and where it's headed.
Lower timeframe (15m): shows a precise entry point.


Assalamu alaikum wa rahmatullah wa barakatuh.
Good morning X
It's weekend, so touch some grass.
Rules for Drawing Trend Lines:
You need at least 2 reversal points to draw a valid trend line.
A 3rd touch confirms and validates the line.
More touches = stronger trend line.
Always extend your line forward to see how price may react in the future.
Try not to let the trend line cut through the body of any candlestick.

Assalamu alaikum wa rahmatullah wa barakatuh.
Good morning Fam.
Trendline continuation.
Steps to Draw a Trend Line:
Choose your coin and open the chart,
Select your timeframe
Zoom in on the chart
Find where the market reversed (top or bottom)
Connect at least 2 major reversal points
Adjust the line to get as many touches as possible

GM fam
Assalamu alaikum wa rahmatullah wa barakatuh.
Crypto for Beginners lesson continuation.
Uptrend Trend Line:
When the market is moving up, it makes Higher Highs (HH) at the top and Higher Lows (HL) at the bottom.
To draw the line, connect at least 2 swing lows (bottom reversal points) together. The line slopes upward.
Downtrend Trend Line:
When the market is moving down, it makes Lower Highs (LH) at the top and Lower Lows (LL) at the bottom.
To draw the line, connect at least 2 swing highs (top reversal points) together. The line slopes downward.

Good morning X.
Assalamu alaikum wa rahmatullah wa barakatuh.
3 Benefits of Trend Lines:
1. Catches what S&R misses.
Sometimes price breaks through horizontal support & resistance but a trend line can still hold the price.
2. Shows market direction.
A trend line helps a trader understand the long-term direction of the market, leading to better trading decisions.
3. Better entry & exit points.
It helps identify strong and valid points to enter or exit a trade.
